Reflections on the 2022 INDIGO Summer Hack and Learn
Authors:
-
 Juliana Outes Velarde
Senior Data Steward, Government Outcomes Lab
Juliana Outes Velarde
Senior Data Steward, Government Outcomes Lab
-
 Srinithya Nagarajan
Policy Engagement & Communications Associate, Government Outcomes Lab
Srinithya Nagarajan
Policy Engagement & Communications Associate, Government Outcomes Lab
-
 Harry Bregazzi
Postdoctoral Research Fellow, University of Oxford
Harry Bregazzi
Postdoctoral Research Fellow, University of Oxford
-
 Jorge Nozorio Rezende Ikawa, Elrica Degirmen, Andrea Lowe, Ishani Goomer and Anurag Gangwar
Participants, Hack and Learn Summer 2022
Jorge Nozorio Rezende Ikawa, Elrica Degirmen, Andrea Lowe, Ishani Goomer and Anurag Gangwar
Participants, Hack and Learn Summer 2022
Twice every year, the Government Outcomes Lab-hosted International Network for Data on Impact and Government Outcomes (INDIGO) hosts its Hack and Learn event. The Hack and Learn brings together practitioners, policymakers and data enthusiasts to explore how data can be better used to tackle complex social problems and improve outcomes for people. In this blog, the GO Lab Data Steward Juliana Outes Velarde and some of the participants reflect on their experiences of the Summer 2022 Hack and Learn.
Twice every year, the Government Outcomes Lab-hosted International Network for Data on Impact and Government Outcomes (INDIGO) hosts its Hack and Learn event. The Hack and Learn brings together practitioners, policymakers and data enthusiasts to explore how data can be better used to tackle complex social problems and improve outcomes for people. In this blog, the GO Lab Data Steward Juliana Outes Velarde and some of the participants reflect on their experiences of the Summer 2022 Hack and Learn.
One day before the Social Outcomes Conference, we kicked off our Summer Hack and Learn, a community event co-hosted with INSPER Metricis as part of our INDIGO initiative. The Hack and Learn is an international online event where policymakers, practitioners, researchers and data enthusiasts get together and work for two weeks on a particular challenge related to using better data, or using data in a more efficient manner, to improve social outcomes.
For this edition, we had four teams working on very exciting challenges. The ‘Impact Bond spreadsheet review’ developed new variables to capture the cost of impact bond projects. Another team worked with a dataset on education projects from the GO Lab systematic review of outcomes-based contracting. INSPER Metricis sought to build a data dashboard for their outcomes-based contracts dataset, and the final team worked on developing a platform to accelerate the design of impact bonds.
At the end of the event, we all got together for our Show and Tell session. Participants showed the final outputs of their work and received feedback from a panel of experts – Carolina Pedrosa Gomes de Melo (INSPER Metricis) and Milena Castellnou (Education Outcomes Fund). These are hosted on our website, in order to allow practitioners and policymakers to experiment with their practical use. Tis blog summaries the reflections and learnings of participants and highlights the tools they developed over the two week event.
The ‘Impact Bond spreadsheet review’ (Government Outcomes Lab)
The team in charge of reviewing the Impact Bond Spreadsheet was formed by fund managers, funding officers, researchers and data enthusiasts. Our goal was to analyse the different tabs of the spreadsheet and identify which variables were outdated or inadequate to capture relevant data, and which additional variables the community would like to have.
The team decided to focus on the tabs that data holders use to share data on outcome metrics and achievements. After a careful review of those tabs, we concluded that the variables were adequate and did not suggest changes. However, the team noted the lack of data on outcome achievements, and the questions this data could answer.
In addition, the team identified a gap in the variables: there were none designed to measure the cost of delivering an impact bond. team dedicated their two weeks to designing a set of variables to measure the different costs from both the supply side (investor, fund manager, provider) and demand side (outcome payer), with two separate tabs. The new variables will be available in the impact bond spreadsheet in November for everyone to explore and share data on costs.
In the future, this team hopes to better understand the main costs associated with an impact bond, using the data that organisations share once the new variables are live. This analysis should also consider outcomes achievement, allowing us to assess not only the costs associated with SIBs, but also the positive social outcomes they generate.
Creating concise and accessible insights from the mass of evidence on outcomes-based education (Government Outcomes Lab)
Participants were challenged to help policymakers and practitioners access insights from the existing evidence on outcomes-based provision of education. We used data from the GO Lab's systematic review of social outcomes contracts.
The challenge had two parts. First, we further disaggregated key variables to enhance our understanding of the metrics and target population of outcomes-based education projects. We noted that some outcome measures were not easily determined based on information reported in the studies, and that it was difficult to classify the length of time of the outcome measure, as there is no agreed upon standard. We also identified additional disaggregations that would help further build connections between various variables of the study. This work is relevant for policymakers, program planners and others interested in embarking on social outcomes projects.
The second part of the challenge examined ‘missing data’, using the absence of information to further understand the state of the evidence and identify avenues for future research. Choosing a range of themes in the dataset, we produced several visualisations. For all themes, there is a higher proportion of ‘absent’ data than ‘present’. The visualisations therefore contribute a high-level overview of the limitations of the existing evidence base.
A data dashboard for the INSPER outcomes-based contracts (OBC) dataset (INSPER Metricis)
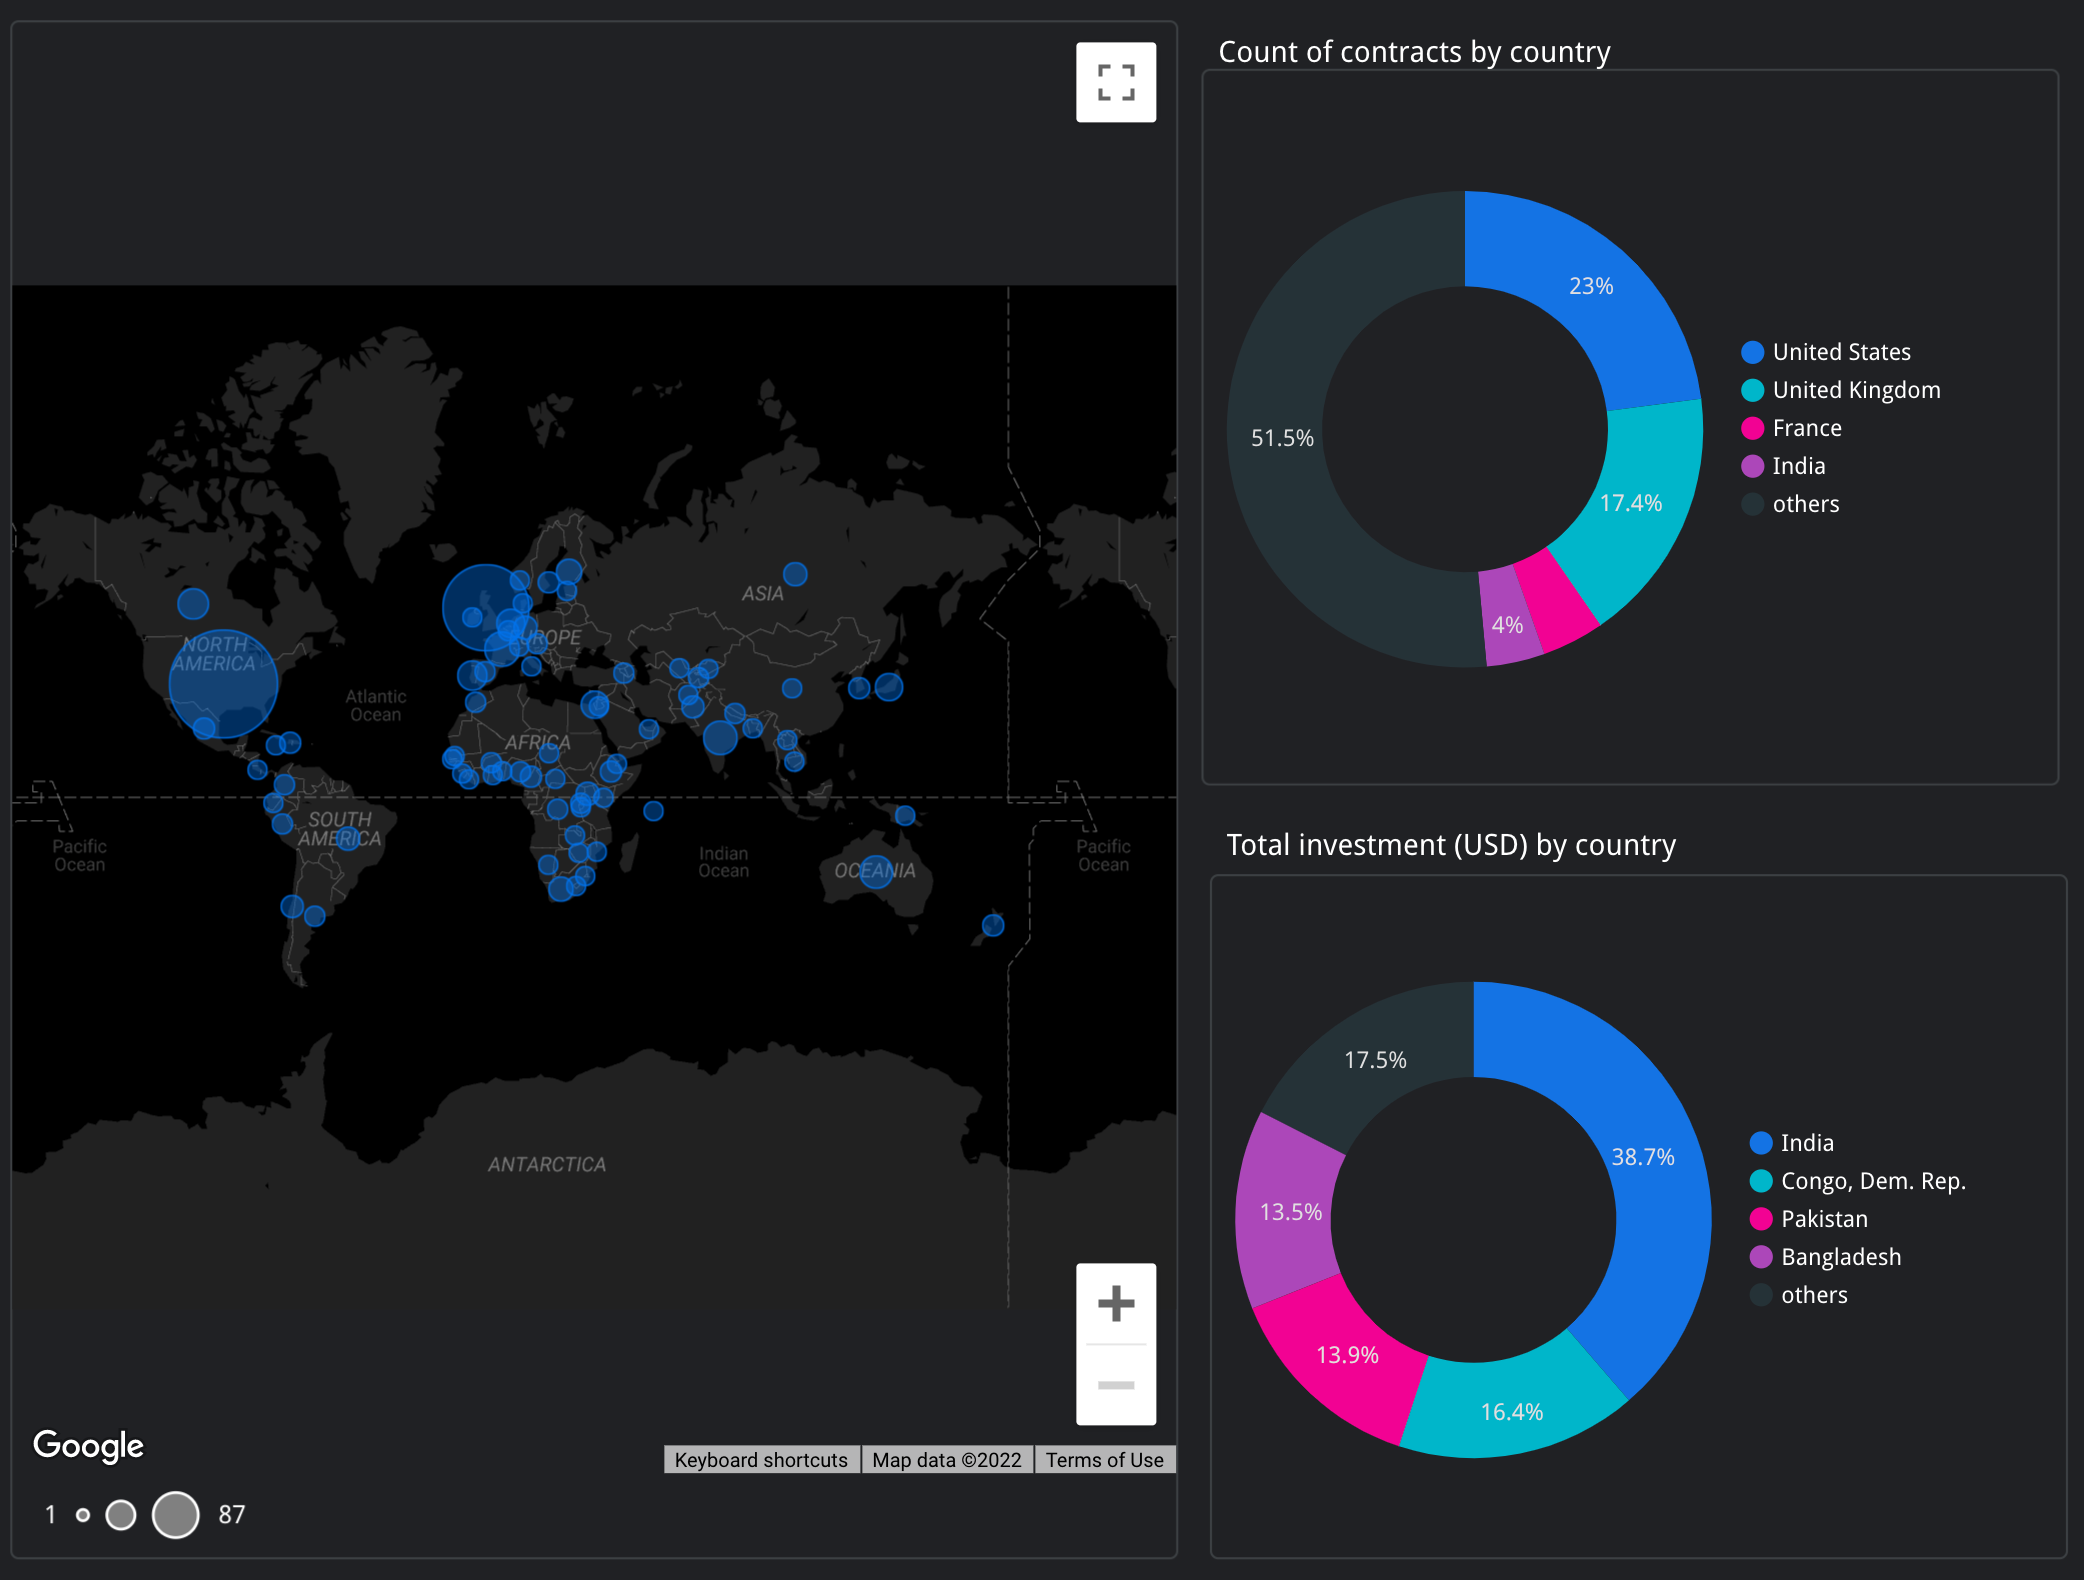
With more than 350 contracts distributed around the world, the OBC dataset provides information on several dimensions of outcomes projects. For this challenge, participants had to learn how to use the dataset, define the most relevant characteristics of the contracts, think about creative ways to present the information and, finally, create a dashboard of indicators.
As a result, the group was able to show how the stage of development of a contract varies by policy area, who the most common investors are, and how the number of contracts has evolved over time. This information can help practitioners better understand how outcomes-based contracts are used around the world and under what conditions they can be a valuable mechanism to drive better social outcomes.
Using Google Data Studio, a collaborative data visualisation platform, participants created a number of visualisations. The group generated interesting insights by testing different type of charts and variables. For example, in the first attempt to visualise which countries are the most engaged with OBCs, participants used a stacked bar chart to show the number of OBCs per country, as well as the stage of development.
However, a redraft looked at the data from a different angle – the number of beneficiaries affected by the number of contracts. In this case, a country may have fewer contracts than others, but relative to the size of its (smaller) population, have experienced more OBCs. This exercise demonstrated how powerful data visualisation can be to better understand the OBC landscape.
A data platform to accelerate the design of impact bond projects (Impactverse)
Small, non-profit organisations often struggle to access financing. Impact bonds might offer a solution, but they present another challenge: they are expensive, time-consuming, and complex to structure. Thus, this challenge sought to simplify impact bond design and make it a viable financing alternative for all stakeholders.
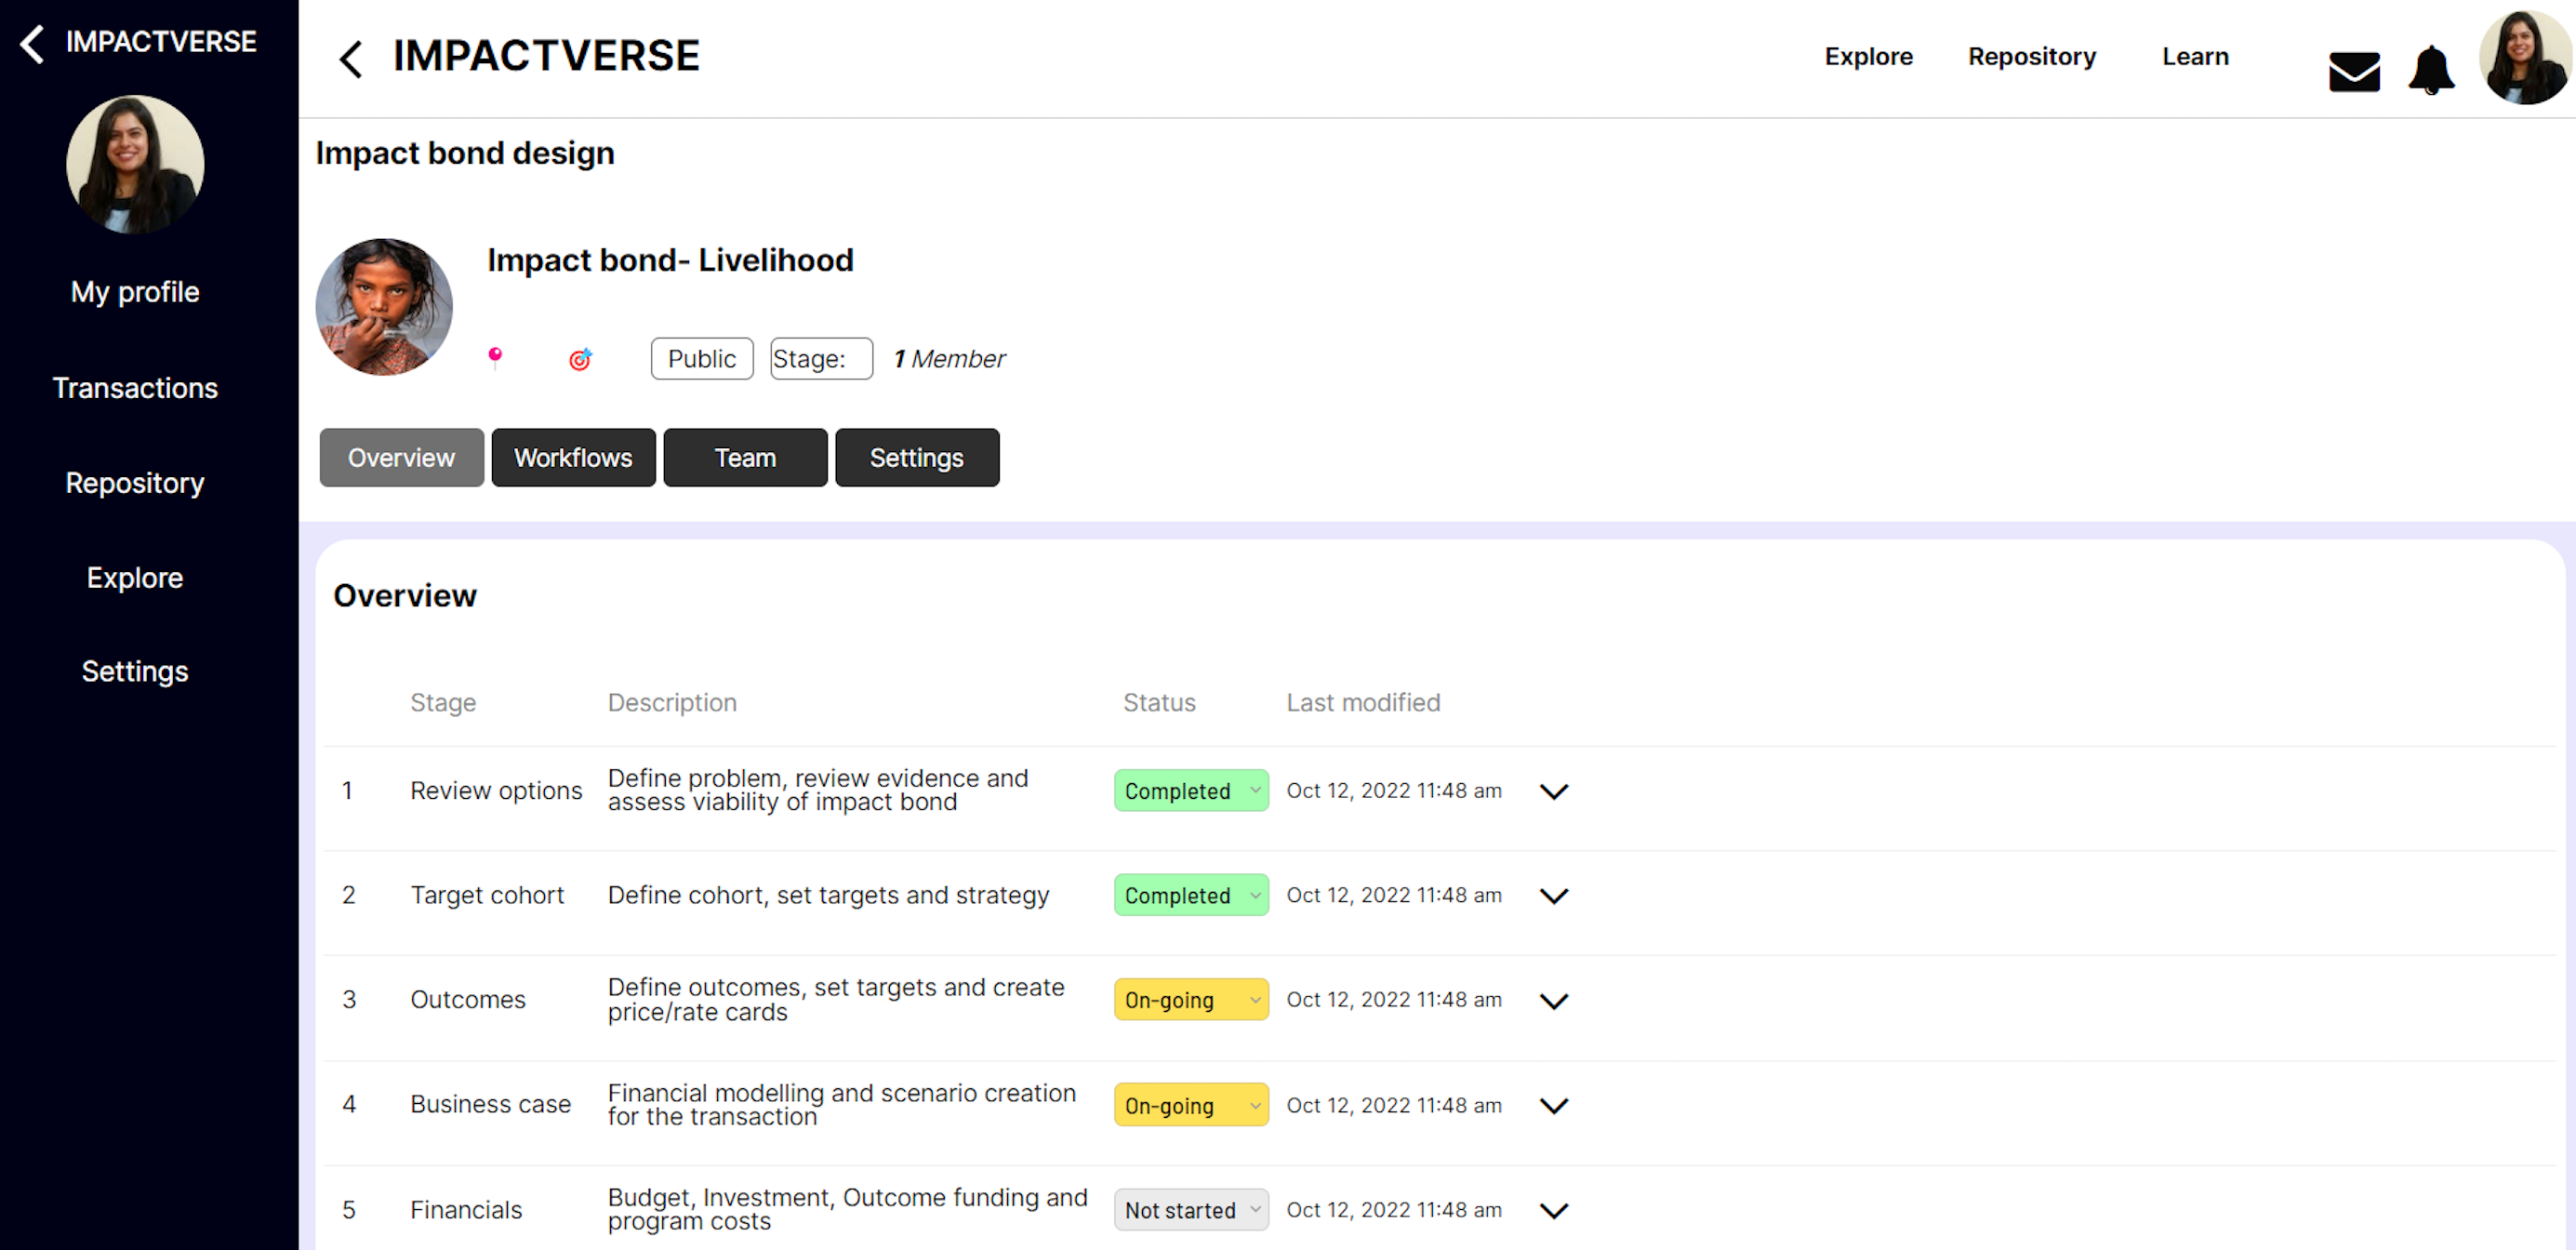
A group of 21 students and practitioners formed a ‘hack team’ and decided to work in 6 sub-groups. Each sub-group worked on a particular stage of the impact bond lifecycle and created standardised templates and workflows for that particular stage.
The contribution of each sub-group was then stitched together into a master impact bond design workflow, that formed a basis for an easy-to-use and interactive digital platform. We hope this can help to reduce structuring and transaction time and costs, and lower implementation risks. At the Show and Tell Session, we offered a demo of the platform, and received feedback on how it could be taken forward. We’d love to hear if you’re interested in the platform.
Next Steps
We had a great time working together during the two weeks, and are very grateful to all the participants who dedicated time and effort to their challenges, and to our partners who co-hosted the event (INSPER Metricis). The next Hack and Learn event will be in March 2023. We are looking forward to the next opportunity to get together with the INDIGO community and address a different set of challenges.
The Hack and Learn is a biannual event hosted by the Government Outcomes Lab and our partners. The event is open to all, and free to attend. We also welcome proposals from external organisations to lead challenges. These are not associated with the GO Lab, and do not constitute a formal partnership with us, but we are happy to provide a platform for those who wish to share learning.