Performance data and the ‘framing effect’: Telling a story beyond numbers
Authors:
-
 Srinithya Nagarajan
Policy Engagement & Communications Associate, Government Outcomes Lab
Srinithya Nagarajan
Policy Engagement & Communications Associate, Government Outcomes Lab
-
 Juliana Outes Velarde
Senior Data Steward, Government Outcomes Lab
Juliana Outes Velarde
Senior Data Steward, Government Outcomes Lab
There is broad consensus on the need to publish the outcome achievement data of impact bond projects. However, presenting outcome achievement data without sufficient context could lead to misinterpretations. The Government Outcomes Lab recognise our responsibility of being an honest knowledge broker.
There is broad consensus on the need to publish the outcome achievement data of impact bond projects. However, presenting outcome achievement data without sufficient context could lead to misinterpretations. The Government Outcomes Lab recognise our responsibility of being an honest knowledge broker.
How we frame performance data could significantly influence how our audience perceives a project’s impact. Concurrent with the release of interim performance data from several Life Chances Fund (LCF) projects, the authors of this blog explore why and how we intend to tell a story beyond the numbers – to supplement the data with an appreciation of projects’ complexity and nuance.
Special thanks to Future Impact for allowing us to use their project's data visualisation in this blog.
What is the Framing Effect?
The framing effect is a cognitive bias whereby people react differently to the same information and choices depending on whether they are presented as loss or gain. In other words, how we frame information influences how we perceive and make decisions about specific situations. This effect highlights the psychological impact that the context or wording of evidence can have on people’s perceptions and subsequent actions.
Understanding the framing effect prompts us to be nuanced in how we present the Life Chances Fund outcomes data. While there is never a single ‘correct’ interpretation of the numbers, we must, as far as possible, ensure that our framing of the evidence enlightens rather than obscures. We have therefore addressed three critical aspects of framing for the LCF project outcomes data.
1. Reference point – How are we framing the ‘target’ of outcomes achievement?
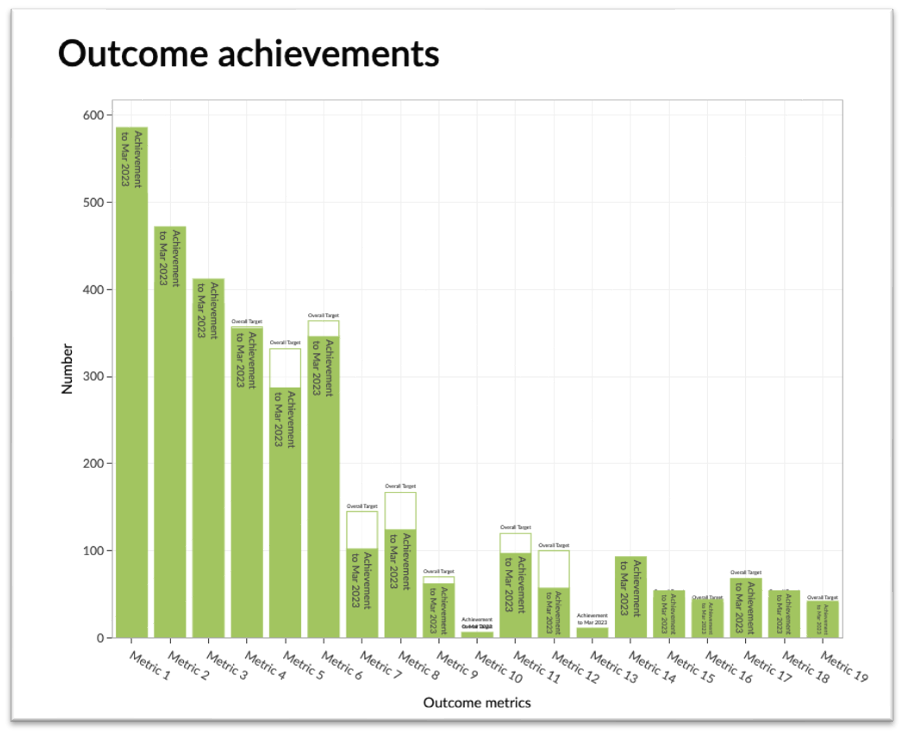
In a seminal work on the framing effect, Tversky and Kahneman drew attention to the importance of a 'reference outcome' for shaping positive or negative perception. A judgement of success or failure partly depends on which reference point is emphasised. When assessing impact bonds, performance targets constitute such a reference (Figure 1).
The target for each outcome is set using data from a project’s preliminary best-case scenario forecast. However, comparing targets and achievements at this point might be counterproductive. As stated, the data released is only interim. Most of the LCF projects are yet to finish, and none of them are expected to have achieved the overall target yet.
Nevertheless, we decided to share the latest targets of the projects. Some of these projects have renegotiated their targets several times (both up and down). We also want users to know the expectations of the central government and local commissioners. We are working to design more complex data visualisations that can show how projects’ achievements compare not to one, but to several, targets from the life of these programmes. This work opens further questions around the relational nature of these projects: How and why did projects renegotiate their targets? How and when do they change metrics, prices or other aspects of their programmes? And, most importantly, are these adjustments beneficial to the service users and their outcomes?
2. How does the variation in payment plans lead to different conclusions?
Another critical aspect of the performance data is the outcomes payment data. Every LCF impact bond has an initial outcomes payment forecast. The forecast indicates the maximum payment that a project can claim in a given quarter. If there are unexpected challenges, projects can renegotiate or reprofile their outcome payment plan. Some of the LCF projects have reprofiled their payment plan multiple times. These are represented in the data visualisation as dotted lines. The solid black line shows the actual payments (Figure 2).
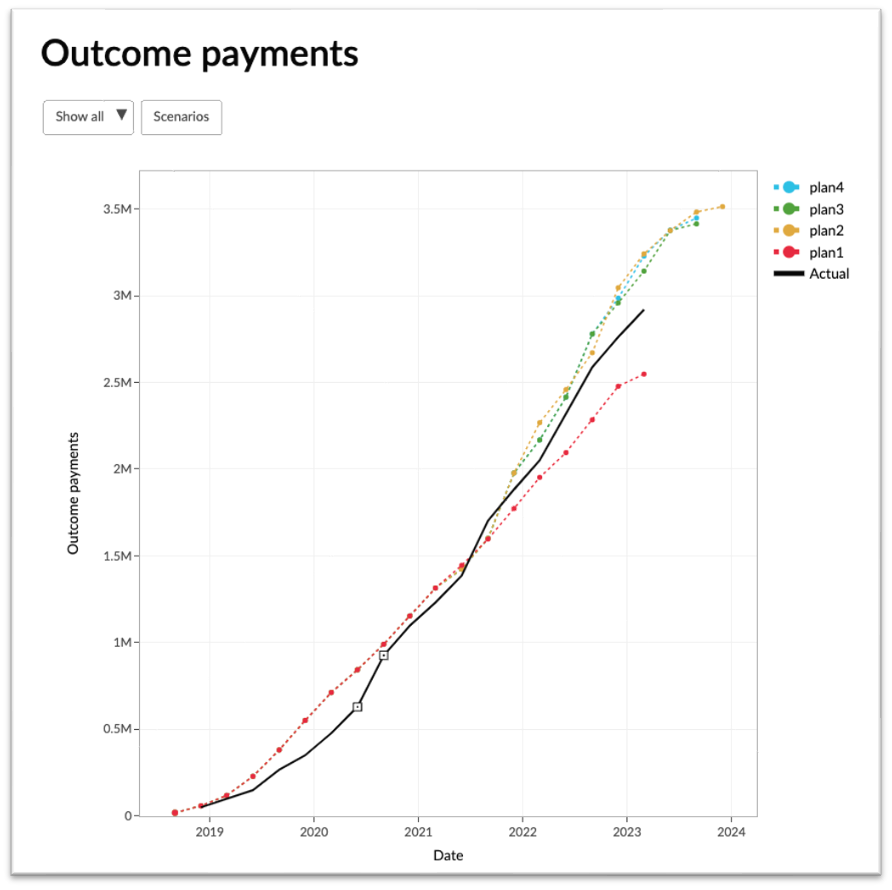
There is no one prescribed way of comparing the planned and actual payments. When we showed the visualisations to project stakeholders, there was no clear agreement about the right benchmark. Most agreed that the latest forecast is the preferred comparator, as it reflects the latest understanding of the project’s potential outcome achievement. However, some recognised the usefulness of the original forecast as a reference to the initial expectations of the government and the Fund.
Thus, we may reach a different conclusion depending on which payment plan is used as a reference. We can only get the complete picture when these other payment plans are considered together within the context of each qualitative story.
3. Beyond the numbers – telling a data-driven qualitative story
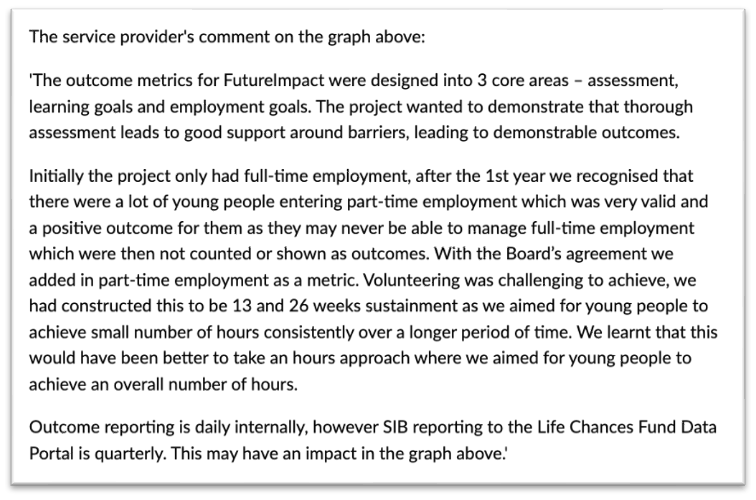
Data visualisations are one component of a richer and more complex story. Stakeholders involved in the Life Chances Fund are keen to share their achievements, but also want to ensure that the data is analysed and understood in the right context. We have therefore created a space for project stakeholders to tell the story beyond the figures, adding context to aid interpretation of the outcomes achievement and payments (Figure 3). Projects can also share links to external resources in this space, such as evaluation reports and testimonials from beneficiaries. We acknowledge that it is impossible to do justice to the stories of such multifaceted projects with only two data visualisations, but this is our attempt to share at least a window to these stories. We trust that you, the users, will seek to understand a more complete story about these projects.
What’s next?
The achievement of targeted outcomes ought to be celebrated. However, we shouldn’t look past the non-achievements. They, too, can teach us lessons that can inform scale-up, or new projects. Rather than labelling these non-achievements as failures, we aim to encourage projects to share them as valuable insights and knowledge gains. These gains could be beneficial in shaping policymakers’ and practitioners’ future decisions, improving policy design and implementation in light of lessons learned.
In future, we would like to share data-driven stories of not just the LCF projects but of all the impact bond projects in our dataset. Do you have data on the performance of projects you would like to share, or have thoughts on how we can build a narrative around data? Please write to us at indigo@bsg.ox.ac.uk.