Pricing outcomes
This guide will help outcome payers in an outcomes-based contract decide how much to pay for an outcome, understand the decisions to be made and offer examples.
Overview
2 minute read
In an outcomes-based contract, either part or all of payment to the provider (and in some cases, an investor) is linked to the achievement of specified outcomes. As a result, the price that is paid for particular outcomes is important to ensuring the contract is successful. Outcome payers should engage with all parties throughout the price development process, to strike a balance between the value to the outcome payer, the cost of delivering the service to providers and the distribution of financial risk.
The parameters for price setting
Ideally, pricing outcomes involves first deriving the value to set the upper bound, then estimating the cost to set the lower bound, before finally setting the most efficient price within the range between value and cost.
Value represents the maximum amount of money the outcome payer is prepared to pay for a good/service.
The value of a particular outcome will vary based on who is paying for it, and depends on a range of financial, political, social and economic considerations. It includes the intrinsic value, comprising all of the long-term benefits of individuals achieving the outcome, and the prevented costs, the fiscal benefits of preventing costly social problems.
Cost is the cost of delivery, development, management and financing to the service provider (and where applicable, investor).
An outcome payer can attempt to estimate the cost in a number of ways. These include engaging with the market, examining the historical costs of the service if it has been delivered previously, or – if it has not - comparison to similar services which are likely to use similar resources.
Price is the amount to be paid for the good/service agreed between the provider and outcome payer.
If there are many potential providers, the price can be set by working downwards from the value, where providers bid at a discount against a maximum price. If the contract is developed with a single provider, the price can be set by working upwards from the cost, negotiating a price that reflects the distribution of risk between parties.
Factors which affect the price
Cohort specification
Cohorts that are harder to help will require more support, resulting in higher costs for the provider, and therefore a higher price. Cohorts with diverse needs require more complex pricing structures, and may be susceptible to perverse incentives.
Level of improvement
The greater the level of improvement required for service users to reach desired outcomes, the more intensive support they will require, resulting in a higher price.
Likelihood of success
If there is more uncertainty about whether outcomes will be achieved, there is more risk to the provider/investor. To compensate for this, they may expect a higher price.
Timing of payment
Later payments for outcomes are more likely to reflect long-term policy goals, but increase financing costs and uncertainty for the provider, requiring a higher price. In contrast, earlier payments can reduce financing costs and lower uncertainty, leading to a reduced price, but potentially fail to deliver long-term goals.
Additionality
Ideally, payment should only be made for outcomes over and above what would have happened anyway. If it is believed some outcomes would have happened without the provider’s intervention, the price should be reduced accordingly.
Budgetary constraints
If an outcomes-based contract is particularly successful, the outcome payer may have to pay out more than expected. This can be mitigated by defining payment caps - either on the total payment to providers, or on the total payable outcome per individual.
Introduction
5 minute read
1.1 Payment mechanism
An outcomes-based contract (OBC) involves the provider’s charges being linked, in whole or part, to the achievement of defined business outcomes for the customer, rather than being based on input costs, such as labour, or outputs, such as transaction volumes. For instance, a contract for the provision of training to support unemployed people into work may have payments linked to the proportion of trained individuals that find employment and maintain it for a minimum period.
An OBC can be underpinned by an impact bond (IB), where a third party investor provides up-front working capital to fund provision prior to outcome payments being made, and takes on the risk of non-payment if outcomes are not achieved. This relatively new type of financing method has been used in countries across the world. IBs originated in the UK which as of mid-2019 has the greatest number globally. They are in line with approach taken by the World Bank Group’s Maximising Finance for Development. They have been adopted in a number of countries to address a range of problems including supporting children at risk of being taken into care, tackling homelessness, improving health outcomes, reducing offending and a range of other social issues.
The idea is simple and powerful, but it requires a clear definition of who is affected by the social issue you aim to address (the cohort), what ‘good’ looks like for those people (the outcomes), and how much to pay if that is achieved (the price). These three considerations – cohort, outcomes and price – are all inter-related. Changing one will affect at least one of the others.

Approaches to defining the cohort and choosing which outcomes to pay for are examined in our guide to Setting and Measuring Outcomes. They are equally important in circumstances where it is desirable to measure outcomes, but the funder or buyer of the service does not want to move immediately to outcomes-based payment. However, in this guide we aim to create a framework to support an outcome payer who wants to pay, in part or in full, for the outcomes achieved.
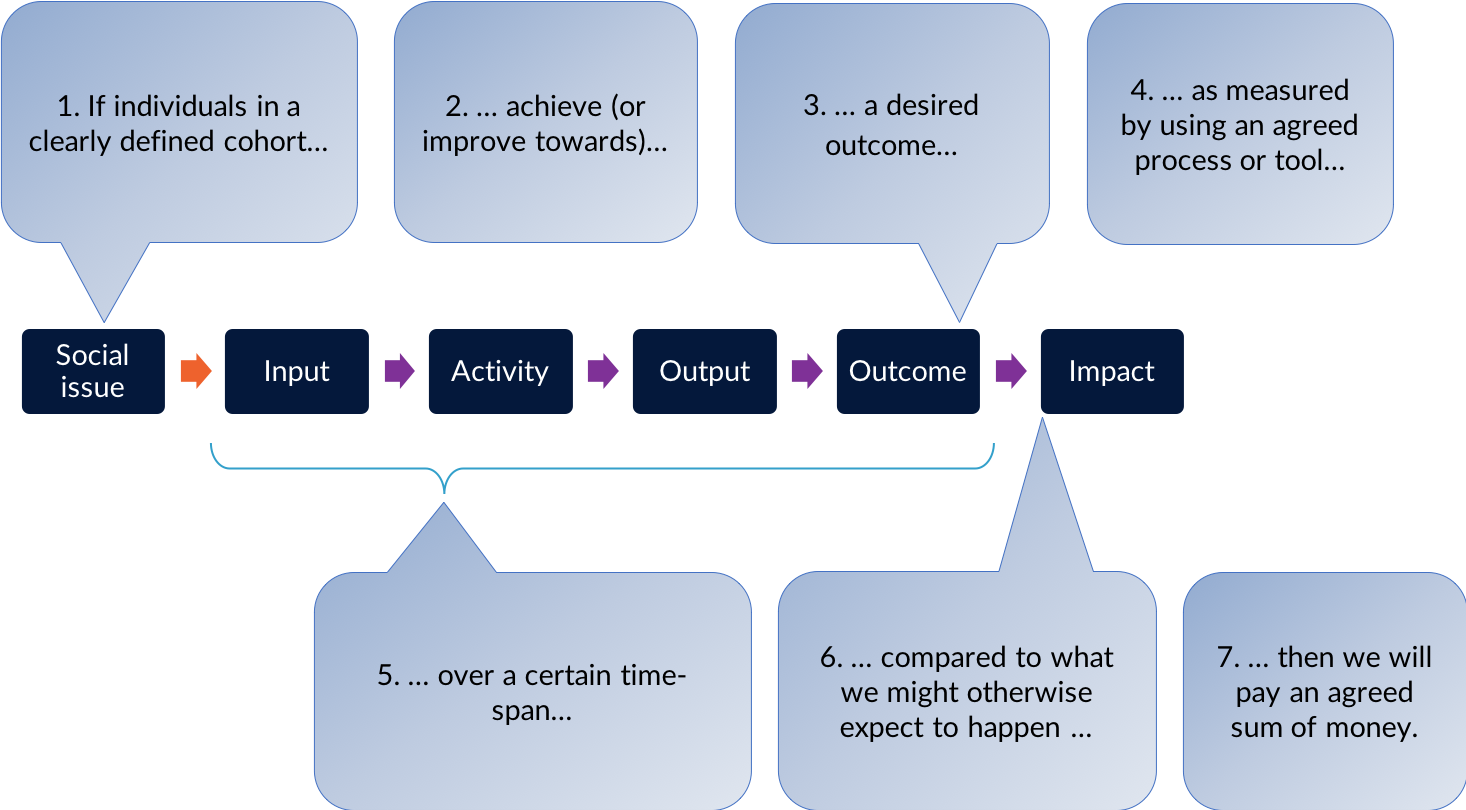
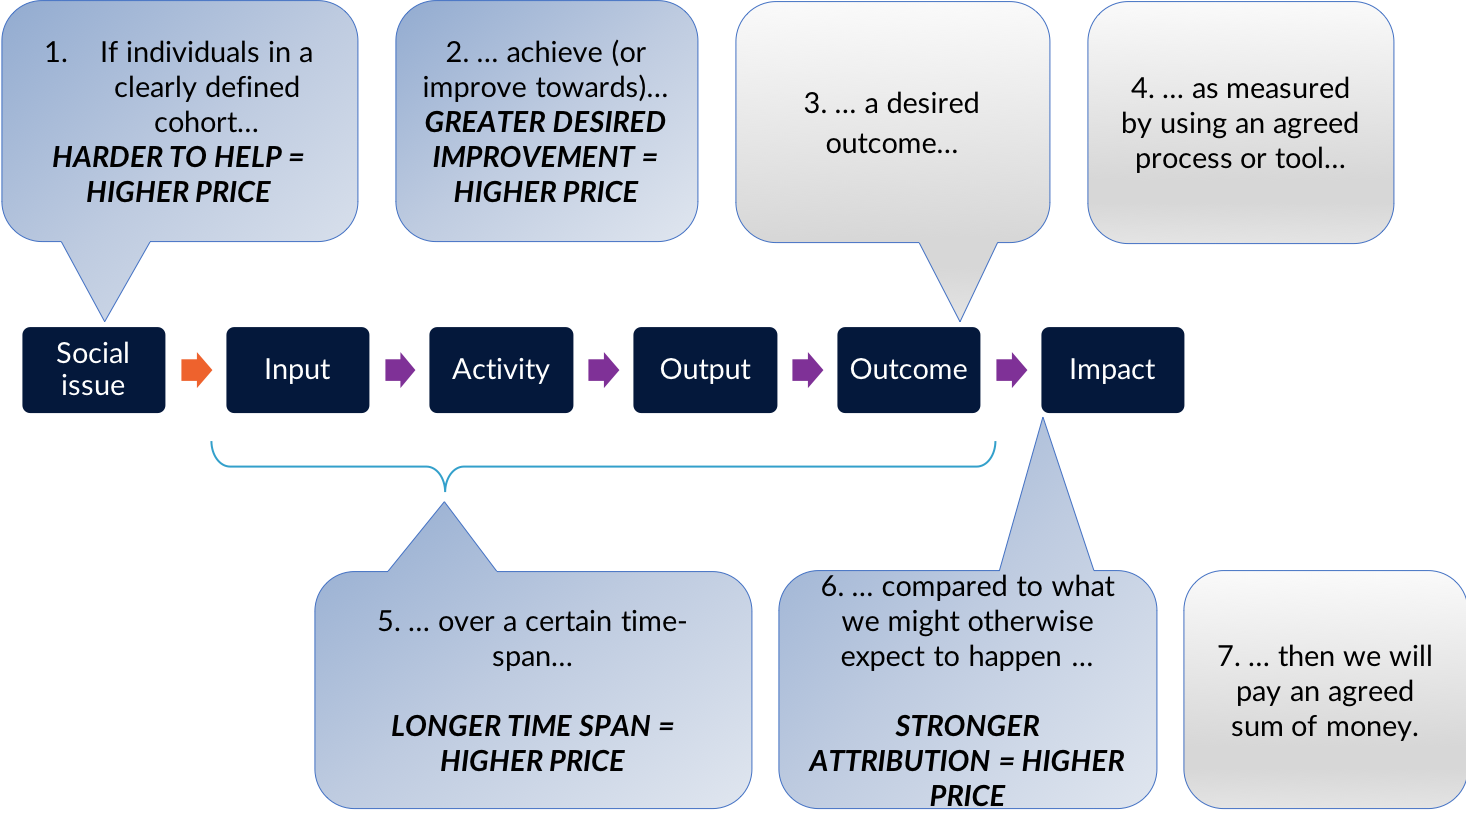
The basic ingredients underpinning a payment mechanism may be summarised in the following sentence:
“If individuals in a clearly defined cohort achieve (or improve towards) a desired outcome, as measured by using an agreed process or tool, over a certain time span, compared to what we might expect to happen otherwise, then an outcome payer will pay an agreed amount of money.”
A theory of change, or logic model, can be a useful tool to describe the social issue you are considering and how people may benefit from the service or ‘intervention’ the provider(s) will deliver. A theory of change describes how ‘inputs’ (i.e. resources such as money and staff time) are used to deliver ‘activities’ (e.g. recruiting participants and setting up a mentoring scheme), which produce outputs (e.g. beneficiaries participating in the mentoring scheme), which will lead to desired outcomes (e.g. improved engagement at school) and impact (e.g. better education results and life prospects). The theory of change tool is useful in the processes of setting and measuring outcomes and evaluating outcomes-based contracts. While it relies on a much simplified version of the messy reality of improving outcomes for people, it remains a popular approach.
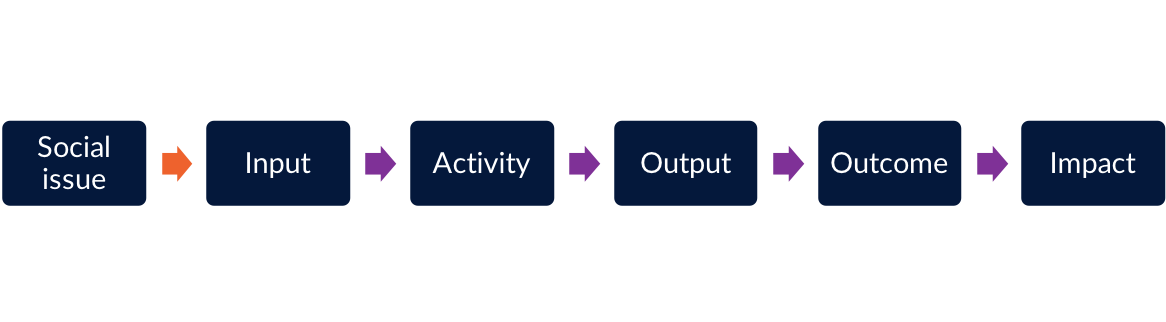
Figure 1.3 shows how the basic ingredients underpinning a payment mechanism map against a basic “theory of change”.
1.2 Pricing outcomes within the payment mechanism
The payment mechanism is an important aspect of the contract that will influence how the outcome payer(s) manage the relationship with the delivery organisation and other stakeholders, and monitor progress.
It is worth noting that it is not the only tool that should be used in order to effectively manage your outcomes-based contract. It is important to distinguish between:
- Minimum service standards, which you will specify in the contract and use to hold the provider to account for – e.g. safeguarding procedures.
- Reporting requirements, which you will use to monitor the progress of the intervention, and to discuss ways to overcome unexpected challenges with other stakeholders and build a culture of ongoing learning. These metrics may monitor progress and impact both before a set key payment trigger and beyond the payment.
- Defining the cohort and desired outcomes, and working out how to measure them
- Putting a price on outcomes which are to be paid for, which are the focus of this document.
You may wish to consider a payment structure that combines elements of a ‘fee-for-service’ contract and elements of an ‘outcome based’ contract. For instance, you may agree initial payments for outputs or activities (such as engagement and assessment) and later incentivisation payments subjects to the achievement of desired, longer term outcomes.
1.3 Using an engaged approach
For an outcomes-based contract to work effectively it needs to strike a balance between what is valuable to the outcome payer and what is possible from a service delivery perspective, and acceptable from a financial risk perspective. That is why it is important for outcome payers to engage with providers and (in the case of impact bonds) investors throughout the process, from start to end. A fundamental purpose of using an outcomes-based contract and SIBs is to generate a shared understanding between an outcome payer and providers of ‘what good looks like’, i.e. the desired outcomes, and to allow more autonomy for the provider to use their skills in bringing about the desired outcomes. Although defining the aspects of a payment mechanism will, by necessity, seem like ‘technical’ work, remember that the contract and the payment mechanism should strengthen and not weaken the relationship between outcome payer and provider.
For this reason, often outcome payers see a benefit in treating the contract more as a partnership than a transactional relationship. As this guide will show, there are many aspects of pricing the outcome where feedback from the market is helpful, or even essential. There will of course be limitations around how much providers and investors can share and some information might be commercially sensitive. An outcome payer should be clear upfront as to how the information shared will be used, and agree terms of sharing information with all those engaged. A partnership approach (especially if it is to work in the long-term) requires trust and transparency, and relies on parties conducting the negotiations in a spirit of openness and honesty.
An outcome payer should be prepared to allow room for revisions (prior to procurement) and negotiations (as part of the procurement process to appoint provider(s) and/or investor(s). It is important to allow sufficient time throughout the project development process for these conversations to take place. An outcome payer might find it helpful to set the right expectations within their own organisation around (i) the timeframes for completing the work, (ii) the need to have some flexibility in the negotiations with the provider(s) and investor(s) and (iii) the fact that numbers are indicative in the early stages and subject to change during procurement negotiations.
In the process of pricing outcomes, it can be very helpful to discuss with others who have faced similar questions. The GO Lab has a range of activity that supports peer learning, including regional workshops and events, as well as the impact bond knowledge club.
The parameters for price setting
18 minute read
2.1 Steps in price setting
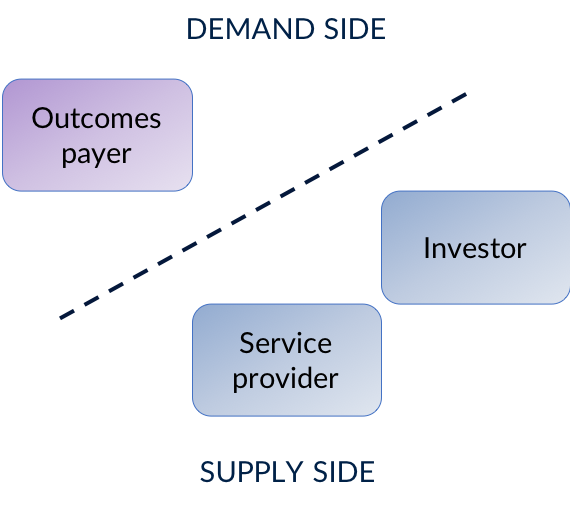
The fundamental economic concept of supply and demand is important to the pricing approach. The demand side contains the customers who have a willingness to pay up to a certain amount to acquire a good or service. The supply side is represented by the providers who are willing to sell their good or service for an amount greater than (or equal to) the cost of producing it. In an outcomes-based contract, the outcome payer (e.g. the funder or commissioner) represents the demand side, and the supply side is represented by the provider. In an impact bond model, the investor usually joins the supply side (see our guide to awarding an outcomes-based contract for more on how impact bonds are structured).
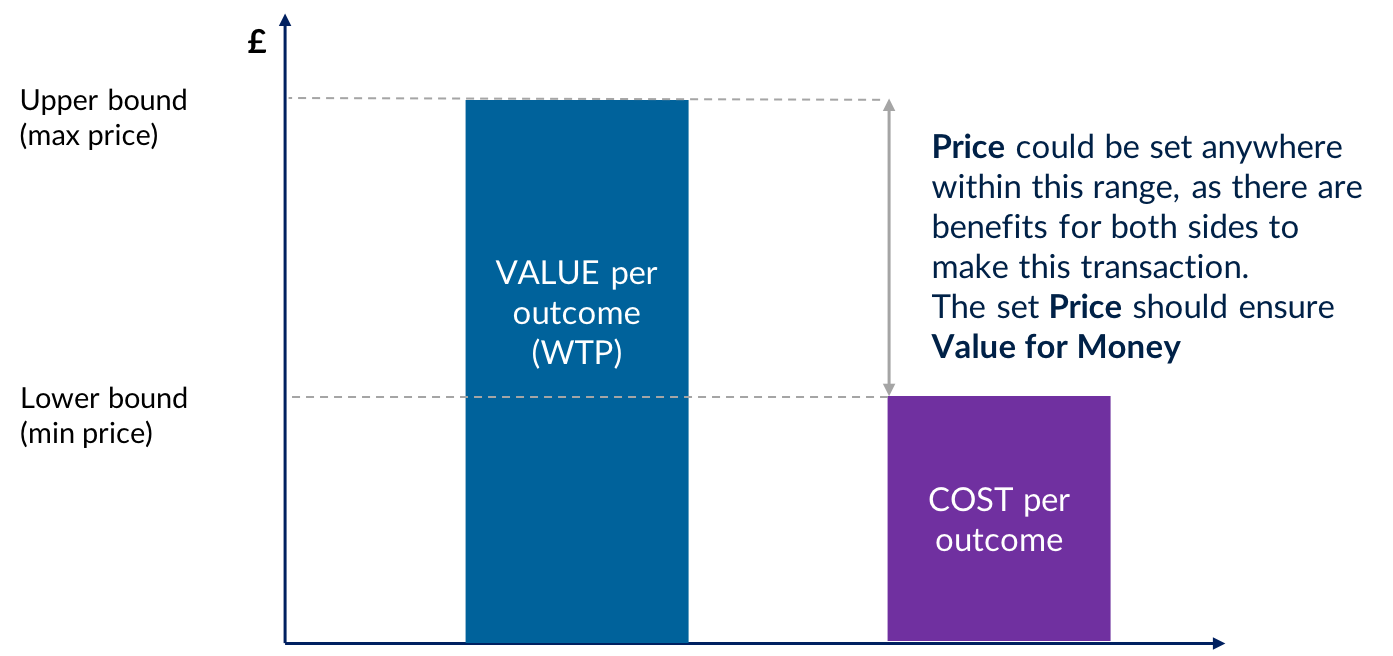
- Value represents the maximum amount of money the demand side is prepared to pay for a good or service (the ‘willingness to pay’ or WTP). In this case, value is ascertained from the perspective of the outcome payer.
- Cost is ascertained from the provider’s perspective, and includes not only the cost of delivery, but also development, management and financing costs. As we will explain, outcomes-based contracts always have financing costs, which will vary according to the perceived level of risk of achieving the required outcomes, and the length of time before outcomes are paid.
- Price is the amount of money to be paid for the good or service. In an outcomes-based contract, there can be a price for each outcome, and a price for the outcomes in total, agreed between the provider and the outcomes payer.
If the price is lower than the value, the outcomes payer benefits from the transaction. If the price is higher than the cost, then the provider benefits from the transaction. Therefore, ideally a transaction only takes place when the value is greater than (or equal) to the price and price greater than the cost. Figure 2.2. shows this graphically.
- Derive the Value. This sets the upper boundary (i.e. the maximum price) of either total payment, or payment per outcome, by estimating the ‘economic value’ of the outcome
- Estimate the Cost. This sets the lower boundary (i.e. the minimum price), by determining the costs to the provider of delivering the service.
- Set the Price. This sets the most efficient price within the range between value and cost. There are different considerations to ensure value for money.
If it is not practical to both derive the value and estimate the cost, it is possible to set the price by either working downwards from the value, or upwards from the cost, as explained in 2.4 how to set the price.
2.2 Derive the value
Deriving the value allows the setting of an upper-bound to what can be paid. Value can be subjective: not only might value of an outcome vary according to who is paying for the outcomes, but there may also be different perspectives within a governing body or outcome payer, and also across time. In short, value is in the eye of the beholder, and is dependent on a range of financial, political, social and economic considerations, which vary according to the organisation or body concerned.
As an example of a national government’s finance ministry perspective, on defining the value in the UK public sector, the HM Treasury's Green Book addresses the ‘Scope of Benefits’ concept by grouping benefits with respect to their scope into three sections: (i) Direct public sector benefits (to originating organisation); (ii) Indirect public sector benefits (to other public sector organisations); (iii) Wider benefits to society (e.g. households, individuals, businesses).
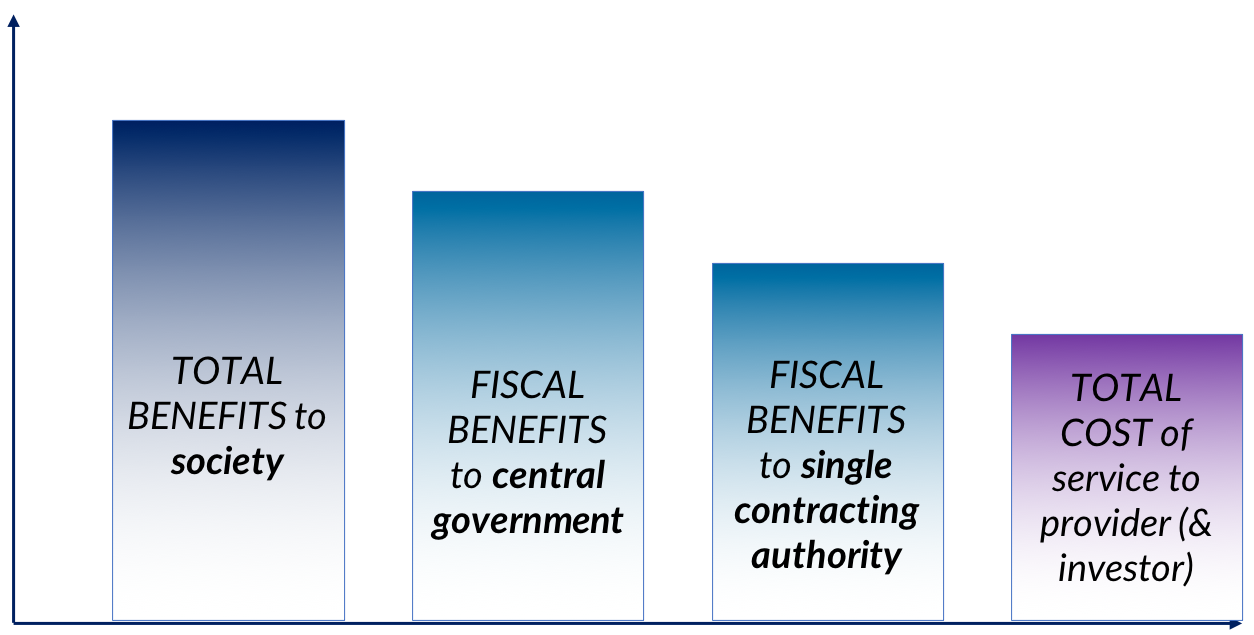
This kind of national perspective can be very important when a central government is the outcomes payer, or is supporting others to pay for outcomes.
However, most outcomes payers have to look at the value of outcomes from a much narrower perspective. If there is a private outcome payer, local and regional government, or single central government department, they are more likely to consider:
- fiscal benefits i.e. savings in their own budget;
- the fulfilment of their responsibilities and duties;
- their political and/or social priorities.
It is usually hard, for example, for an education department to pay for reduced offending outcomes, or for a health department to pay for reduced homelessness, even though those benefits could well occur as a result of work those departments paid for.
This is one of the reasons why some countries have set up outcomes funds. Government as a whole can support projects which produce wider societal benefits, which an individual department or regional / local government cannot afford to fund.
Depending on the circumstances, defining the value may not always be possible or useful. Where this is the case, you might wish to refer to 2.3 estimating the costs.
However, it may be helpful to put a figure on the value for two reasons:
- There is a reason to understand the overall economic benefit of individuals achieving certain outcomes, for example to make the case for new spending, or for collaboration between multiple departments.
- The business case relies on unlocking future budget savings to particular departments or sub-national governments as a result of individuals achieving certain outcomes.
2.2.1 Intrinsic value
The intrinsic value of an outcome is an attempt to put a monetary figure on all the long-term benefits that might occur for society when an individual achieves particular outcomes. It goes beyond direct fiscal benefits to the outcomes payer. Often, this value is defined in moral and political terms – it is the reason why we educate children, rehabilitate offenders, help rough sleepers, and so on. But especially in the case of national government, it is possible to attempt to quantify the value using Cost-Benefit Analysis (CBA). CBA is widely used across governments to appraise spending options. It attempts to calculate the value to society of achieving the outcome. Most governments will have an approved approach to CBA so we do not cover in detail in here. For example, the UK has CBA guidance for local partnerships. This gives a word of caution, though: “CBA is not an exact science and its outputs are a guide to decision-making, not a substitute for thought’’.
2.2.2 Prevented Costs
Calculating prevented cost is an attempt to calculate the fiscal benefits that might occur when an individual or group achieves particular outcomes. This approach focuses on how the achievement of certain outcomes now might reduce costs to the outcome payer in the future. It uses a similar form of analysis to the ‘intrinsic value’ approach, but with a narrower focus.
Preventing costly social problems from arising in the first place, or reducing their incidence, is often likely to lead both to better social outcomes for people and lower public sector spending.
However, it is difficult to allocate resources to preventative activities when there are budget pressures, and the available funding often has to be prioritised towards people in need of urgent care to be supported first. Furthermore, the difficulty of knowing for sure whether the preventative activities will actually deliver their demand reduction promises, challenges the ability to invest in long-term preventative activities.
An outcome-based contract may help enable a focus on preventative activities that will lead to better future outcomes, and reduced demand (and therefore costs). It also has the potential to enable ‘double running’ of budgets, where preventative and remedial work is run in parallel, provided the demand reduction unlocked by the preventative work is able to generate genuine future budgetary savings.
2.2.3 How to calculate the value
Whether you are seeking to calculate intrinsic value or prevented costs, the approach is similar.
Most importantly, as mentioned at the start of this guide, it is important to have a clear understanding of the cohort or group of people for whom better outcomes are targeted. You can read more about this in our guide to Setting and Measuring Outcomes.
You should then start to think about all the benefits arising from the achievement of a certain outcome. If you are seeking to calculate the overall intrinsic value, you will need to consider them all. But if you are seeking to calculate prevented costs to a particular department or sub-national government, who will also be the outcome payer, you probably just need to focus on the first two: cohort member and outcome payer.
- The cohort member – what has changed for them as a result of the outcome? Is it immediate, or will it impact something in the future? How long will the impact last for them?
- The outcome payer – what is the impact on your organisation as a result of the outcome? Does it increase or reduce your spending now, or will it affect it in the future?
- The public sector – are there other impacts elsewhere in the public sector (to other local or central government bodies)? How does it impact upon their service provision or spending?
- Wider benefits to society – are other individuals impacted? Do non-public sector organisations (e.g. local businesses) benefit? Are there any wider impacts on the local community or area?
Your aim is to quantify, each of these benefits as well as being able to describe what the impact looks like. Sourcing this information can be difficult; ideally the scope and scale of these benefits will come from research done on the cohort you are aiming to target. It is advised to follow a conservative and evidence-based approach to pre-empt future criticism when discussing with other partners.
In some cases either an outcome payer or service providers might be able to provide data or feedback on the types and/or quantity of benefit. Alternatively, you may need to rely on published research for similar cohorts.
These benefits will fall into two broad categories: Fiscal benefits and economic/social benefits. Fiscal benefit sare impacts on the public sector budget which are either ‘cashable’(where expenditure released from the change in outcomes is freed up and can be reallocated elsewhere, e.g. no longer needing to spot-purchase residential children’s care) or ‘non-cashable’ (which represent a benefit to the public from freeing up resources even if public expenditure is not reduced, e.g.. reduced demand from frequent attenders in A&E allows staff to concentrate on more critical cases). Economic/social benefits not only consist of such benefits, but also wider gains to society that are often harder to identify and value in monetary terms.
- Fiscal benefits (both cashable and non-cashable) can be estimated using cost to the public sector organisation responsible for delivery. Ideally you will be able to calculate these using data collected within local public sector organisations. Some jurisdictions may have nationally used unit costs – for example, the UK has the Health and Social Care Unit Cost database published by PRRSU or The New Economy Unit Cost database.
- Economic/Social benefits includes fiscal benefits and more. Those other benefits are often harder to monetise and economists will use a range of techniques to estimate them. You will need to do some research to ensure you are using values relevant to your outcome and cohort. Again, there may be some useful national ‘collections’ of these values: for example, the UK has the New Economy Unit Cost database referenced above, and the National TOMS Framework, and there is guidance in Chapter 6 of the Green Book.
There are some benefits for which it is either unfeasible, or undesirable, to derive monetary values for – such as greater wellbeing. These should still be considered alongside those in monetary terms, in order to decide if your actual ‘willingness to pay’ is higher than the final monetary figure.
Where a program is commissioned on the basis of prevented costs, then unlike in the intrinsic value approach where a degree of estimation of the benefits of outcomes being achieved is permissible, it is important to be as precise as possible about the fiscal benefits to the outcomes payer and when these will occur. The outcomes payer is agreeing to pay for outcomes directly as a result of the savings that they expect to make, which will often actually finance those outcomes payments. Therefore, the focus will be on the “cashable” savings.
It can sometimes be quite straightforward to determine the cashable savings of a programme. For example a programme might be intended to reduce the number of children who have to be placed in the care of the state. If that care provision is paid for on a spot purchase basis at a known cost, and by the same agency that intends to pay for outcomes in a proposed outcomes-based contract, then there is a known direct saving to the outcomes payer if the number of children who go into care is reduced.
In other cases, though, it is much more difficult to determine cashable savings.
This may be because for example:
- The savings are hard to cash e.g. reducing the number of people who are sent to prison only saves prison costs if prisons can be partly or wholly closed down. If existing prisons are merely rendered less overcrowded, then, although this may deliver some intrinsic value (such as more productive ex-offenders) and non-cashable savings (such as more capacity in the prison system), prevented costs are likely to be much lower.
- Some of the savings may have been realised anyway and cannot easily be attributed to the program, e.g. if there is reduced offending amongst the cohort against a wider trend of falling crime which may account for some of the reduction.
- The savings occur too far in the future e.g. a program may reduce hospital admissions over the next five years, but the outcomes payer only has the flexibility to pay for outcomes which deliver savings within one year.
- Savings may go to organisations other than the outcomes payer e.g. a mental health programme for disadvantaged young people paid for by a school may help to reduce the chance of future offending, but the reduction in offending does not save that school any money.
2.2.4 Limitations in calculating value
Once the analysis of value is complete, you should reflect on these figures to decide the total value of the outcomes, and this total should represent the upper limit of public sector’s ‘willingness to pay’ for achieving that outcome (although in reality it is unlikely the analysis has been able to capture and monetise all the benefits).
If you are one of many public sector organisations identified in the analysis, you may wish to price an outcome based only on your own fiscal benefits. Alternatively, you may wish to use the analysis to engage other public sector outcome payers in order to price the outcome in accordance with realised benefits for them.
Proper analysis of the direct and wider impacts of outcomes can help to justify or reject the use of particular outcomes for payment, and provide a rigorous basis for a decision on expenditure by an outcomes payer. It can also help construct the case for co-commissioning or facilitating cross-agency working. For example, this approach can be useful for contracts which aim to meet the needs of individuals who move through different existing services which do not work well for them under the status quo. It can also provide a starting point if a service is completely new.
On the other hand, it can be difficult for teams with little or no analytical resource to make use of the tools of cost benefit analysis. Furthermore, if the analysis has not used local data, but relies on standard datasets, it may undermine trust in the resulting figures.
Depending on the issue being addressed, the time delay between the intervention and the achievement of medium to long term outcomes which are of most value to the outcome payer may make an outcome based contract unfeasible for a provider and/or social investor.
There can also be a problem in this approach with "prevalence”: the number of people in the target group who display (or might go on to display) the undesirable results which the intervention is intended to mitigate (or avoid).
There can also be a problem with “deadweight” which is the term often used for those who would have achieved a positive outcome even without the intervention.
The issues of timing of payments, prevalence and deadweight are all discussed further in Chapter 3.
Where a precise calculation of value cannot be carried out, it is possible to commission services through an outcome based contract using an estimated value derived from limited data.
It may then be possible to run an evaluation which makes a more robust assessment of the range of benefits which are delivered. For example, an IB designed to reduce rough sleeping might tie payment only to that – but the price paid may also have factored in expected reductions in crime and health service costs. A robust evaluation can show if these were achieved as expected, and therefore whether the price paid was justifiable, and further commissioning is warranted.
| Intrinsic value | Prevented Costs | |
|---|---|---|
| Key concept | Government’s ‘willingness to pay’ for a social outcome | Potential future budgetary savings |
| When helpful? | When value of an outcome is not primarily financial. When the desired benefit is co-commissioning or cross-agency working. | When an intervention to prevent a social problem from developing for an at-risk group is likely to be effective |
| Type of analysis to do |
Monetary value of economic, social, and political benefits using economic theory. Cost-benefit analysis. |
Root-cause analysis. Statistical analysis of how people ‘flow’ through the system, what are their needs on the journey and what is currently offered at what cost (to whom). Cost benefit analysis of successful prevention. |
| Strengths | Can help make the case for central government funding, co-commissioning or collaborative working. Cashable savings not a priority. Can provide a starting point if the service is completely new. | Develops understanding of root causes of problems. Can enable flexibility in delivery as different means of prevention are attempted. |
| Limitations | Can require considerable analytical resource. A budget line to pay an amount based on this method of calculation must exist or be created. |
Can create a large financing gap for providers (if the avoided negative outcomes would be a long time in the future). Risk of paying for the prevention of things that would never have happened anyway. |
| Resources | UK Treasury green book Unit cost database that has been developed by New Economy. |
What Works Centre evidence synthesis. Unit cost database. |
2.3 Estimating the costs
Estimating the cost allows the setting of a lower-bound to what the provider should expect to receive from the contract, if they achieve a satisfactory level of performance in achieving outcomes. The lower bound of the price paid for outcomes should cover the costs the provider (and/or investor) have to endure in order to achieve the outcomes at the level expected. As a result, it is useful for the outcome payer to derive an understanding of what these costs might be. Of course, if they do not achieve the expected level of outcomes, their costs will not be covered.
It is important to distinguish between the cost to the provider for delivering the outcomes (the lower bound), and the cost to the outcome payer, which includes any surplus (or "profit") the provider may seek (which the outcome payer will want to minimise) and management and monitoring costs to the outcome payer. This is illustrated in Figure 2.4.
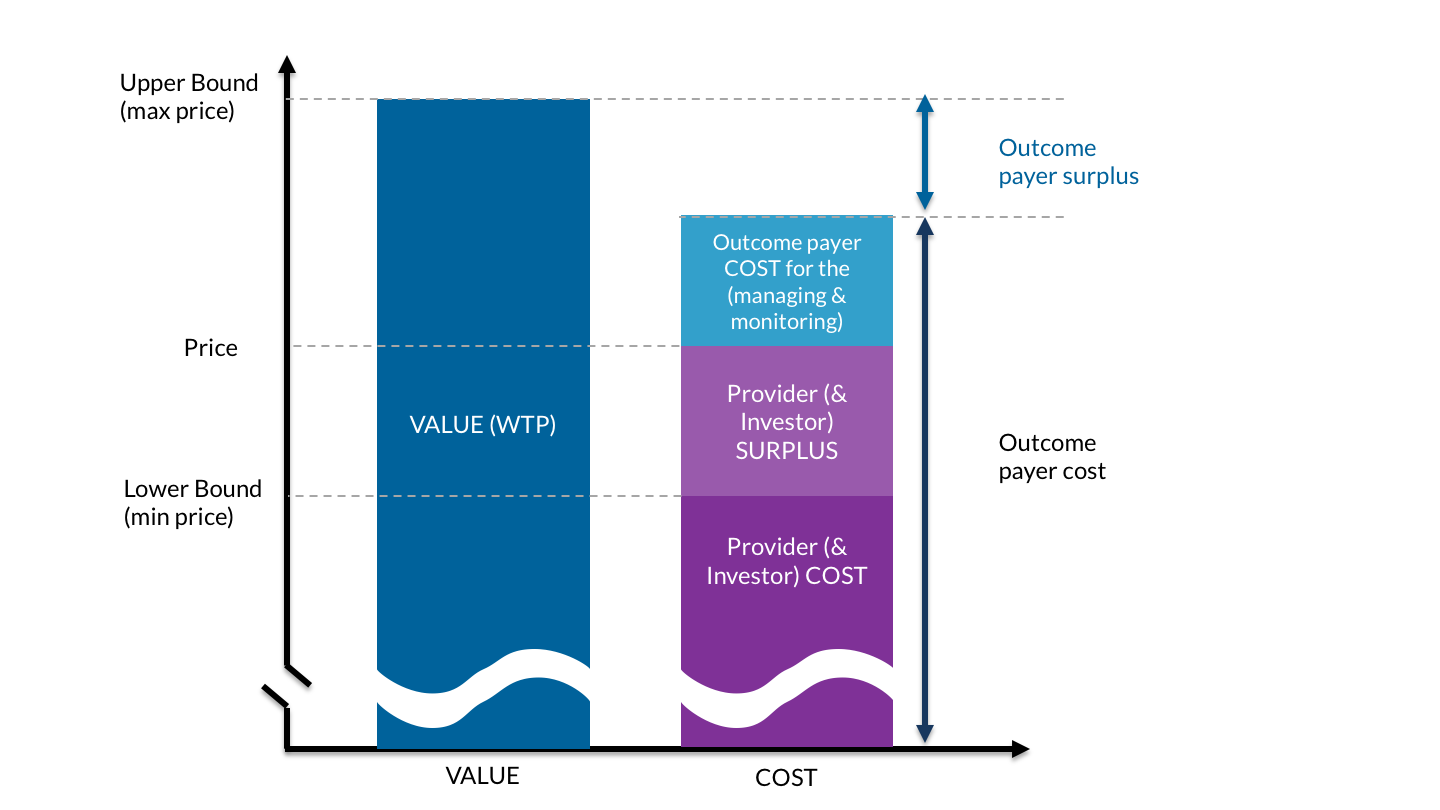
While outcome payers may seek to minimise provider surplus / profit, underpaying for outcomes can be as dangerous to the success of an outcomes-based contract as overpaying, because it may mean that no bids are received, may discourage high quality providers, and may encourage cherry picking whom they work with i.e. focus their efforts primarily on people for whom the defined outcomes can be achieved most cheaply, whilst ignoring those who need the most help. This is discussed further in Chapter 3.
The importance of estimating provider costs may be reduced if you are operating in a competitive environment where real competition on price is likely to occur, and the market can be relied upon to deliver value for money. However, where there may be very few providers or investors in a position to deliver the contract, there may not be a competitive market, and a greater degree of transparency may therefore be needed around provider costs than would be necessary where a functioning provider market exists.
An example of how costs might be broken down into a number of components is shown in Table 2.2. This example assumes that the impact bond is being led by an investor who sets up a special purpose vehicle (see our guide for more on IB structures). In other impact bonds, these costs may be split between the investor and provider, and perhaps also an intermediary and evaluator as well.
It is important to note that whilst the operational costs of delivering the contract are likely to be easily the largest component, there are sometimes significant costs associated with development and design, contract set up and negotiation and evaluation.
| Cost Category | Cost Sub-category |
|---|---|
|
DEVELOPMENT & DESIGN Pre-contract signing search and information costs |
Due diligence of potential providers |
|
CONTRACT SETUP & NEGOTIATION Bargaining and Contracting Costs |
Legal advice on contract design (including tax advice & either external or internal) Financial advice on contract design (either external or internal) SPV Setup Costs Reworking of business and financial case |
|
OPERATIONS COSTS Governance, monitoring and evaluation costs |
SPV operational costs (including salaries) Performance management (Staff) Data management (Technical) Outcome reporting &/or compliance with validation method cost Service delivery costs (upfront payments) Service delivery costs (later payments) Governance costs (e.g. board meetings) Tax (total) Outflow to investors* |
| OTHER COSTS |
In outcomes contracts, the finance costs borne by the investor and/or the provider are passed on to the outcomes payer if the program is successful. These may vary significantly depending on the source of the finance, the amount of investment required, and the perceived level of risk of achieving enough outcomes to break even.
There are three ways that an outcome payer can try to gain an overall understanding of costs: market engagement, historical costs, or comparable services.
2.3.1 Market engagement
It may often be possible and desirable for outcomes payers to gain an understanding of the likely investor and provider costs of a proposed program through market engagement and/or asking for the information as part of a tender process.
2.3.2 Historical costs
This approach applies if the intended outcome requires a service that has been used previously on a similar target population. In this case, you should have an idea of the price of such services which enables you to get an estimate of the likely total cost of outcomes, provided that a similar service is proposed for the outcomes contract.
An estimation based on historical costs is often easier to pursue if an existing service is being re-let, as that gives a ready comparison. As there is already a service in existence to compare with, then a lot of the uncertainty about referral rates, level of need of the client group, and to some extent level of anticipated success, are also reduced. As we discuss later in "3.6. dealing with uncertainty”, in the case of IBs this may also imply that investor returns could be lower.
After finding an estimate of the intervention costs, it is worth considering the possible additional costs of an outcomes-based contract, as shown in Table 2.2. above. However, it is not necessarily the case that an outcomes-based contract is more expensive to deliver than a standard contract. The extra discipline of having to achieve outcomes in order to receive payment might drive increased efficiency, which is likely to bring down the costs of delivering a given number of outcomes.
2.3.3 Comparable service / reference costs
Where there is no historical service to compare, it may be possible to refer to comparable services which are likely to use similar resources/inputs. This should provide an approximate of expenses required to deliver the outcomes. Once again, additional costs specific to outcomes-based contracts should be taken into consideration.
2.4 Setting the price
Payment mechanisms should include generous enough payments to provide a quality service to the target population, which accepts that the risk taken by providers/investors of not succeeding needs to be balanced by the potential to make a surplus if they do well. Prices should be fair for all parties, high enough to be commercially viable and low enough to avoid windfall profits for investors and unnecessary expenditure by outcomes payers.
- Working downwards from the value. Where there are many potential providers, a “maximum price” can be set for each outcome based on the value calculation, or for the outcomes as a whole, and providers can be invited to bid at a discount against it. (There may be different discounts against different outcomes, in which case you can score on price based on the weighted average discount).
- Working upwards from the cost. Where the contract is designed in collaboration with a single provider, a “minimum price” can be set based on the cost of delivery estimate, and a price negotiated above that based on the distribution of risk between the parties.
Whichever of these is used, a number of assumptions will need be made, which will affect the price. These “parameters” are as follows, and are discussed in detail in Chapter 3.
- Cohort specification: how difficult it is to help the target cohort (harder cohorts demand a higher price)
- Level of improvement: how ambitious the target outcomes are (greater ambition demands a higher price)
- Likelihood of success: the level of uncertainty about whether the targets will be achieved (greater uncertainty demands a higher price)
- Timing of payment: when the payments are made (later payments demand a higher price)
- Additionality: how reliably the outcomes are measured to show they are additional to what might happen otherwise (greater reliability demands a higher price)
- Budgetary constraints: Whether there is a budgetary limitation on the total possible payment
The best way to analyse the effect of these parameters is to build a financial model, where different assumptions can be made, and the probable effect of these on the price explored.
An additional parameter might be currency risk, if costs are incurred in a different currency from that used to pay for outcomes (which can be the case in international development). This parameter is not discussed further.
Some of these parameters are illustrated in figure 2.4.
Often the analysis of these parameters is best done through active, structured engagement with market. We discuss different approaches to market engagement and procurement, and the pros and cons of these, in our guide to awarding outcomes-based contracts.
2.4.2 Assessing the value-for-money
Whichever pricing approach is used, a full and detailed assessment of value-for-money can be done. There is a full discussion of how this might be approached in the Appendix. There are three criteria that can be used for this (this is based on the UK’s National Audit Office and Department for International Development).
- Economy: minimising the cost of resources used or required (inputs) – spending less
- Efficiency: the relationship between the output from goods or services and the resources to produce them – spending well
- Effectiveness: the relationship between the intended and actual results of public spending (outcomes) – spending wisely
Factors which affect the price
17 minute read
As outlined at the beginning of this guidance, the price you set will interact with the cohort definition and outcomes you expect to achieve, which is why the approaches described in Chapter 2 only give you a sense of the upper and lower bound, rather than a final answer. You need to strike a balance between multiple considerations in order to create useful incentives to achieve outcomes. There are two risks if these considerations are not taken into account. The first is the risk of underpaying for outcomes – in which case you will end up with a contract that is impossibly expensive or risky for a provider to deliver (and most likely none will offer to). The second is the risk of overpaying for outcomes – in which case providers make unreasonable profits / surplus and you do not get value for money.
3.1 Cohort specification
As a basic rule-of-thumb, cohorts that are harder to help or have further to ‘travel’ in order to achieve the desired outcomes will be more costly to work with, as they will need more intensive support. As we describe in the likelihood of success section below, harder-to-help cohorts will also tend to be less likely to achieve the outcomes than easier-to-help ones. This increases costs. These increased costs need to be compensated through the payment mechanism.
Cohort specification will enable you to (i) define a specific cohort of people with key characteristics and (ii) estimate variation in difficulty-to-help amongst beneficiaries. How easily can you describe the characteristics of those for whom you are commissioning the service? The more targeted and similar the cohort, the most straightforward the approach to price setting can be. On the other hand, the more diverse the needs are of a cohort of people who exhibit the specific problem which is being targeted, e.g. being homeless, or being unemployed, or having a drug problem, the more an outcomes-based contract may be beneficial, because of the difficulty in specifying a single service intervention applicable to the whole cohort.
The more comparable the levels of need in a cohort, the less the risk of ‘perverse incentives’ (for example, there is less risk that a provider may ‘cherry-pick’ and only work with ‘easier cases’). This makes knowing how much to pay easier: it can be discovered through market engagement or by examining the cost of in-house provision.
In many cases, however, it will be difficult, or incompatible with the purposes of the program, to identify a cohort of sufficiently similar people, especially for services aimed at supporting people with complex needs. Often a cohort will be large and diverse with broad a range of needs and potential intervention / support packages. In these cases, it is still possible to reduce the risk of ‘cherry-picking’, in three ways:
- ensuring a referral process that is independent of the service provider. For example, using professionals not attached to the service provider to decide who is eligible for the service. This prevents the provider being able to pick easier cases for themselves, as someone else is deciding for them.
- preventing over-recruitment by setting payment triggers linked to the proportion of referred beneficiaries who achieve the outcome, or capping the number of referrals. Over-recruitment may occur when you pay for each individual who achieves the agreed outcomes. Without safeguards, paying for individual outcomes may create a perverse incentive by which providers may accept (or recruit) very high number of referrals and work only on ‘easier cases’ to trigger payments, ‘parking’ a high proportion of difficult cases. If a certain proportion of the cohort needs to achieve an outcome to trigger payment, or if the number of referrals is capped, they cannot do this.
- setting different prices for different sub-groups within the cohort. This means the providers can be paid more for resolving more difficult cases. It should be noted that this adds complexity and can create other unintended effects, as the criteria for selection of the sub-groups may not align well with the real costs of achieving outcomes for them.
3.2. Level of improvement
A key part of defining payable outcomes is setting a point of improvement from a baseline at which payment is made. This can be referred to as the ‘threshold’, ‘target’, ‘metric’, ‘milestone’, or ‘trigger’ at which the payment outcome is deemed to have been achieved. We will use the word ‘target’ here. Essentially, it means defining ‘what does good look like’ or ‘what is a meaningful improvement’? The basic rule of thumb here is that the greater the level of improvement desired within the cohort identified, the greater the value of the improvement and the more costly it is likely to be for providers to achieve the targets, as they will need to offer more intensive support, leading to a higher price paid for the outcomes. In the last section we discuss ways to tackle uncertainties around a provider’s likelihood of achieving the level of improvement set out.
The longstanding discussion in education about how to measure learners’ performance is perhaps a helpful analogy to think about the forms these targets can take. The question is whether student performance is best measured by attainment / proficiency (meaning a student’s performance against a universal benchmark at a given time), or progress / growth (meaning a student’s performance improvement or decline over time, relative to the average or their own starting point). Proponents of progress or growth scores say that using attainment or proficiency scores encourage teachers to focus less on those students who fall far below the attainment threshold, and unfairly stigmatises schools whose intake has more of these students. They argue that we should be using progress or growth measures if the goal is to assess schools on how well they serve students, not on which students they serve. To take an example from the UK, the long-standing but now abandoned ‘A*-C’ measure of GCSE grades is an example of how an attainment-based cut off can have these effects, as it encouraged schools to disproportionately focus resources on students on the C/D borderline, at the expense of those expected to get lower and higher grades.
In the world of defining outcomes, the same logic holds true. You can think about fixed, binary targets – like an ex-offender not re-offending during a set period, or someone who is homeless living continuously in accommodation over a long period – as though they are attainment scores. Indeed, evidence suggests that they risk focussing providers’ attention on beneficiaries who are around the cut-off point, often at the expense of individuals who have further to travel. For instance, a binary payment for ‘not re-offending’ would incentivise providers to work with offenders who only offend few times to bring this down to zero, rather than working to reduce reoffending rates for people who have a history of many offences (without being able to eliminate them entirely).
Targets that reflect the ‘distance travelled’ may be more accurately estimated and reduce these risks, but it can be more challenging to measure them – typically requiring more granular and ‘sensitive’ measures or measurement approaches. In taking this approach, you will need to either (a) measure, and take into account, an individual or cohort’s starting point, and determine an acceptable amount of progress to have made by the end; and/or (b) show degrees or ‘steps’ of improvement, and add extra payment targets to reward these. Either of these approaches adds complexity, but it is key to think about them and to create a solution that addresses these points.
On the other hand there are areas where distance travelled towards a goal may have little value unless the goal is achieved. For example, supporting a person who is a long way from being “work ready” to being closer to work ready may not be worth much if that person still doesn’t get a job, unless the work done has other benefits such as improved mental health.
You can read more about tackling these issues in our guide to setting and measuring outcomes.
3.3 Likelihood of success
All stakeholders in an outcomes-based contract need to understand how likely it is that the project will achieve the proposed outcomes. If outcomes seem harder to achieve, either because the cohort is difficult to help or because the desired level of improvement is high, then the probability of achieving outcomes will be lower, and the contract will be deemed riskier – and risk demands compensation. In the case of impact bonds, social investors backing bids to provide working capital to finance the contract will take this into account in the level of financial return they expect – higher risk calls for higher potential returns.
There are a number of ways to make future performance projections and you will want to use a combination of all of these. To have a goal in mind, it is helpful to identify a range of values. For instance, you can estimate a ‘minimum expected scenario’ (sometimes termed ‘base case’), a ‘best case scenario’ and a ‘worst case scenario’.
Using historical data – If you have well documented data and a good historical data record, these would be a good starting point for a first estimate of the likely success of the project and how many outcomes are likely to be achieved.
Using existing evidence / academic research – in some cases, there will be existing evidence or academic research indicating how successful a particular programme or approach will typically be. For example, the Ways to Wellness social prescribing programme used the results of a pilot programme carried out by Nesta to predict how successful the project would be.
Running a procurement process with dialogue – by running a procurement process that allows for dialogue with multiple providers, you can compare competing claims on likelihood of success, and whether the estimates you are being given are based on robust assumptions. While providers will naturally want to show they have the greatest chance of success, it is important to assess how realistic the prediction is – or whether it seems overly optimistic. Please refer to the guide on awarding outcomes-based contracts for more about the different procurement approaches that allow for this sort of dialogue to take place.
Using the expert judgment and data of a provider – in some cases, you may be procuring a completely innovative service, or working with a new cohort who have not been previously identified or worked with. In these cases, you may be using an outcome based contract because you are not able to determine the likelihood of success and need to rely almost entirely on the projections of a provider, which you will want to test the rationale for. The risk is higher in these experimental scenarios, though the contract enables some (or all) of the financial risk to be transferred.
Use a learning contract or pilot period – You could procure services anticipating an initial period where you closely monitor the implementation of the intervention and improve your understanding of what level of outcomes it is feasible to expect. This would also allow you to identify the key barriers and strengthen your performance management system and payment metrics. At the end of this initial phase you can firm up your payment mechanism in collaboration with other stakeholders. There are examples in the UK of approaches like this being used. You still need to have a well reasoned baseline scenario before starting the contract, and should use this flexibility as a genuine opportunity for learning in partnership with other stakeholders. Good stakeholder relationships and a level of trust, as well as a clearly defined process for future price adjustments, are required to avoid the danger of the provider exploiting the flexibility to ‘move the goalposts’ in, say, year 3 of a 7 years contract. Our guide to awarding outcomes-based contract has more detail on how contractual terms can be used to safeguard this approach.
3.4. Timing of payment
The timing of payments is important. Generally, the later the payments can be, the more likely it is that they will align with the achievement of your long-term policy goals, as you are more likely to know if the ultimate outcome is both achieved and sustained. There is also a benefit to the outcome payer of later payments, because money can be used for other things in the interim. Furthermore, in economies where inflation is high, there may be an additional benefit to later payment (unless you choose to include inflation in the pricing). These timings benefits can be quantified by using discounting (as shown, for example, in Chapter A6 of the UK treasury’s Green Book).
Often, though, there are practical implications for providers (and investors) to such long-term payments, meaning you should consider adding payments for ‘proxy’ or ‘lead’ outcomes (or even outputs as long as the final target in an outcome) in addition or as alternatives. You can read more about identifying these sort of outcomes in our guide on setting and measuring outcomes.
The cost implications of the timing of payments is all to do with the fact that an outcome based contract creates a financing need for a provider organisation. A provider provides a service upfront but is not paid until later, when outcomes are achieved – so they have to use their own money, or borrow it from someone else (like a social investor). The effect of different timings on this is best illustrated with a simple example:
- Your goal is to get 100 people who regularly sleep rough into stable accommodation.
- It takes your provider on average 6 months to get people into accommodation.
- They will then provide up to 12 months of ongoing support to people once they are in accommodation, to ensure they are stable.
- They are paid once people have spent at least 12 continuous months in stable accommodation.
- This all means your provider has 18 months of outgoings for 100 people, with income coming at the end.
- They will go heavily into the red for the delivery of this contract – likely to mean they will need to borrow more money or secure investment to keep delivering the service.
- This borrowing (or investment) will come with an interest payment (or return expectation) which will have to be built into the contract cost.
The same basic principle applies whether providers self-finance, take out a loan, or receive backing from a social investor who pays them a traditional service fee and takes the financial risk on themselves. The longer the provider or investor has to wait to receive payment for the delivering of outcomes, the higher the strain on their finances, and the greater the cost. On the other hand, later payments help with the outcome payer cashflow and enables them to use their money on other projects, as well as reducing the risk that they are wasting their money on outcomes of limited value e.g. a homeless person who sustains accommodation for a short time but then becomes homeless again. The outcome payer might therefore attempt to ensure the sustainability of results by setting both early and late payments in a way to keep the providers (and/or investors) incentivised.
| Pros | Cons | |
|---|---|---|
| Earlier payments |
Lower risk for provider (& investor) Guarantees some early indications of progress |
Greater risk to outcome payer Weaker incentives for provider (& investor) to achieve long-term outcome |
| Later payments |
Lower risk for outcome payer Defers outgoings for outcome payer, so cash can be used elsewhere |
Greater risk for provider (& investor) Can be complicated to budget for uncertain future payments |
You could add an additional earlier payment, for example at the end of 6 months, for any participant who has enteredaccommodation. This is not really the goal you are looking for – as they may soon return to sleeping rough – but, it means your provider would expect to get some income sooner, so will go less into the red, need to borrow less money to run the contract, pay less interest, and require a lower amount to be built into the contract cost.
In addition you may consider payments for activities and outputs as well as for outcomes. This will have much the same effect in enabling the provider to get some payment sooner, but at the possible expense of reducing the focus on desired outcomes, or alignment to the policy objectives.
In short: outcomes which are paid early on in the delivery phase can lower the cost of financing for the providers (and/or investors), but may lessen the focus on longer term outcomes that are usually more aligned with the overarching policy aims of the project.
Note that a greater focus on longer term outcomes, as well as increasing the financing amount, can also increase the provider’s (and/or investor’s) perception of risk. This can result in an increase in interest payments or financial return expectations. This is discussed further in the next section, ‘likelihood of success’.
In projects which feature both early and later-term outcome payments, you need to be aware that your payment structure may create incentives for providers to treat these outcomes ‘interchangeably’ and focus solely on delivering short-term outcomes for a higher number of beneficiaries. There are ways to mitigate this: having a limit on the total number of participants whom the provider is allowed to work with within an overall payment envelope (or “contract cap” – see section 3.6 below), and/or higher payments for longer term outcomes.
Although later payments help with the cashflow and cost of capital for outcome payers, it is important to plan their payment in the budget in advance. Public sector commissioners can often only pay money in the year they have the money budgeted for. So it is important to profile the expected level of outcomes payments in each financial year, and if possible build in some flexibility to move money between financial years in case outcomes are achieved later than initially expected.
3.5. Additionality
“Additionality” is one of several related concepts – the others are attribution, counterfactual, and deadweight. While these terms can seem daunting if you are not familiar with them, we use them because they describe useful concepts and some are increasingly widely used.
“Additionality” refers to an impact that is “over and above what would have happened anyway”. You could describe it as “over and above business as usual” or “what we currently expect to happen”. A description of what would have happened anyway is known as the “counterfactual”. Determining the level of “additionality” in a robust way helps to show that any positive effect was indeed caused by the work that was done – this is the concept of “attribution” (i.e. it shows that the outcome is “attributable” to the intervention).
The answer to “what would have happened anyway” is very rarely “nothing”. For instance, in projects aiming to support people back into work, an obvious outcome payment is sustained employment. However, some of the participants might have found an employment over time even without the intervention. The amount of this natural improvement that takes place is called the “deadweight”.It is worth pointing out that deadweight can also work in the other direction e.g. if something happens to other participants to make them less likely to get work than they were at the start of the project.
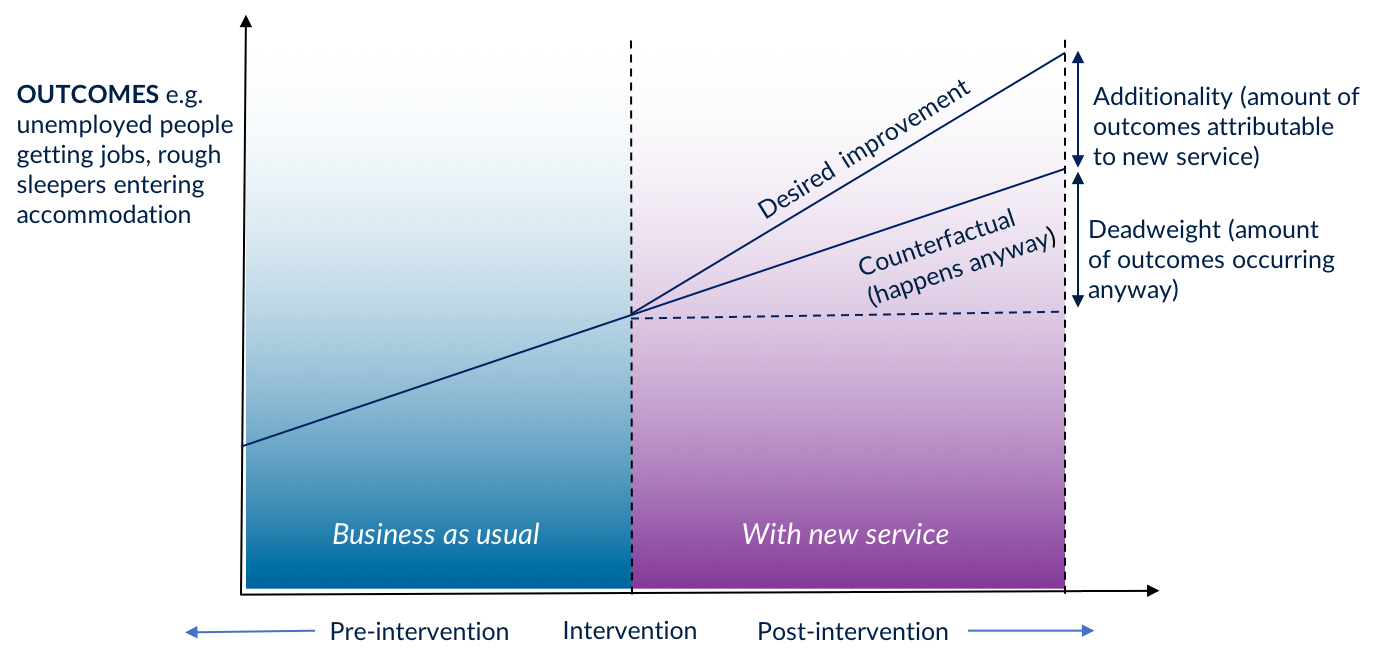
Unfortunately, it is never possible to observe “would have happened anyway” unless you know how to create a parallel universe, and so the best you can do is to estimate it.
If you are running a quantitative evaluation alongside (or as part of) the contract, then it is feasible to think about using statistical methods to estimate “additionality”, such as experimental (e.g. randomised-controlled-trials) or similar quasi-experimental techniques (e.g. pre test-post test). These tend to use some sort of comparison group who share similar features to the cohort being worked with, but who do not receive the same service. We explain these techniques in our introduction to evaluation. For instance, the Peterborough SIB and the Ways to Wellness SIB each estimate additionality by using a comparison group technique.
If you are using one of these techniques as the basis for measuring the outcomes you are paying for, you will have a good degree of confidence that those outcomes are attributable to the intervention. The risk of paying for things that would have happened anyway will be reduced, and there is no need to adjust the price set at the start to account for these considerations.
Often, it is not practical or affordable to use a comparison group to estimate additionality as part of the outcome measurement approach. When this is the case, you should think about factoring a prediction of what the deadweight might be into the price you offer. If the contract is using a “proven” intervention, there may be previous research and/or evaluations that will give you a reasonable indication of the likely level of additionality for that intervention. Alternatively, you can estimate additionality by articulating a “business as usual” scenario, and comparing it to various success scenarios for the new service. If you can access the right data, you might do this through an analysis of historical trends for the particular cohort that is eligible for the intervention, and project those trends in the future. There will be a degree of uncertainty and you might include a range of scenarios which account for high- and low-estimates.
Be aware that this extrapolation into the future may be inaccurate, especially for longer-term outcomes, as other external factors could influence the trends positively or negatively – such as a change in the economic outlook or in other areas of policy. In defining additionality using past trends, you could end up paying for outcomes that would have occurred anyway, because changes outside the control of the provider are making the outcomes easier to achieve. The reverse is also true: you may end up not paying for outcomes that the provider has legitimately achieved, because changes outside the control of the provider are making the outcomes more difficult to achieve than they would have been in the past. As we explain in our guide to Setting and Measuring Outcomes, you can mitigate this by aiming to set outcome measures and targets that are less susceptible to such external factors, but it is difficult to eliminate this risk entirely.
Although such projections carry a level of uncertainty depending on the quality of analysis and the eco-political stability of the study group, they provide us with useful information of the expected outcomes to help communicating better with other stakeholders (see more on uncertainty, optimism bias, and risk in Annex A5 of the Green Book and international equivalents.)
As a general rule, you should adjust either the price or total payment for outcomes downwards if you believe some outcomes would happen anyway (i.e. there is “deadweight”) but you don’t have confidence that you will be able to accurately determine how many (which you might do by measuring a comparison group). This is a legitimate measure to avoid paying for things that would have happened anyway, and to ensure good value-for-money to taxpayers. The possibility of price adjustment should be covered in the contract documentation. See more on this in our guide on awarding outcomes-based contracts.3.6 Risk of overpayment and setting a payment cap
1. Setting a cap on the total payment to providers or on the number of beneficiaries
You can consider setting a cap linked to the available budget for outcome payment. Consider the following relationship:
Total Payment = Payment per outcome x Number of people receiving the service) x Likelihood of success in achieving each outcome
In this approach, you will already have established a price per outcome, so you are setting a payment cap based on a maximum number of beneficiaries for which you will make payments under the ‘best case’ likelihood of success; i.e. Maximum pay is expected when ‘Successful Outcomes’ is equal to ‘Best Case Scenario’. You need to consider that this makes it unlikely the provider would continue investing effort and resources in providing the interventions to more people, as this would be at their own cost. Some providers (or the investors providing the finance) might continue to deliver the service anyway as they value the achievement of outcomes for their own sake and can access the required extra funding. You could discuss in advance with the provider what they expect to do if the cap is reached.
In some cases the cap follows from identifying a specific cohort. For instance, the “Street Impact” London Rough Sleepers SIBs identified the target cohort as consisting of 415 named individuals identified as sleeping rough in a particular dataset.
2. Setting a cap on the total payable outcome per individual
You may have defined a number of different outcomes that you will pay for as and when an individual in a cohort achieves them. As described earlier, this could be because your cohort is diverse, or because you want to include an earlier payment and/or reward progression towards an end outcome. If every individual in the cohort achieves every one of the available outcomes, you will overshoot your budget. However, rather than limiting the overall payment across a cohort, you may want to consider a cap to limit the total payment on each individual. This type of cap signals to providers the need to balance doing intensive work with a single individual with their ability to engage with a higher number of individuals overall (an ‘equity’ consideration). It also helps to protect from the possibility that providers focus on individuals who are ‘easier’ to work with, and who can progress through multiple outcomes more quickly. This is especially helpful when considering that these individuals were more likely to achieve some of the outcomes even without the intervention.
Can a separate cap be set on the provider’s surplus / investor returns?
Setting a payment cap as described above allows you to limit the return that investors can expect to earn from the project. If there are no investors, the same principle applies, but the ‘return’ would be reflected as provider profit or surplus. Providers and investors can use a number of methods to determine the level of surplus or return they anticipate, such as carrying out a financial sensitivity analysis. This analysis plays out a number of scenarios based on the expected outcome success levels.
Investors may be able to take risks on a particular project where they can take a portfolio approach. Across a portfolio of projects that they support, they expect that some projects will be more successful and lead to a higher return, whilst others may be less successful and lead to a loss. If you set a payment cap that limits investor returns, the investor may also wish to discuss a ‘floor’, i.e. a minimum payment that limits the total loss they could incur.
It is worth mentioning that there is not necessarily an inherent need to cap surplus or returns, as in a well-designed payment mechanism, these will be higher when you are getting more outcomes, which is the aim.Case study 4 - Educate Girls development impact bond
8 minute read
1. Introduction
Project Background
The Educate Girls development impact bond (DIB) launched in 2015. It was the 2ndDIB (worldwide) and focused on improving education outcomes for children in Rajasthan, India. The project ended in 2018. Project outcomes were met and core project stakeholders deemed it a successful pilot.
Core project stakeholders (and their project roles) included: Children’s Investment Fund Foundation (CIFF) (commissioner), Educate Girls (provider), UBS Optimus Foundation (UBS OF) (investor), Instiglio (intermediary), and IDinsight (evaluator).
Aim of payment mechanism
If girls and boys in Rajasthan, India at risk of not achieving potential levels of enrolment and education outcomes…
- … achieve an improvement in…
- … school enrolment and education outcomes …
- … as measured by enrolment rates and standardised testing…
- … over 3 years…
- … compared to historical baselines of enrolment rates and the education outcomes of children in a matched control cohort of villages...
- … then outcome funders would pay $367,000 for re-enrolment of 79% of eligible students and improved aggregate scores on ASER tests of 5,592 points across the whole cohort, with outcome payments capped at $422,000.
2. Project scope
Target Population
The project targeted out-of-school girls aged 7-14 and girls and boys in grades 3-5 in the state of Rajasthan in India.
The project focused on children living in the Bijoliya, Mandalgarh and Jahajpur blocks in the Bhilwara district of Rajasthan. The DIB funded interventions for children attending 166 government schools across 141 villages. These schools were randomly selected from a sample of 332 schools in 282 villages.
Aim
The project targeted improved education outcomes via out-of-school girls (re)enrolled in school and education quality, as measured by test scores for girls and boys. It generated outcome-based payments by paying out based on cohort level payments assigned by commissioners to evaluated outcome metrics.
Intervention/Theory
The project funded interventions by Educate Girls, an NGO operating in Rajasthan, India. Educate Girls uses an integrated community-based approach to education that involves increasing access to education for primary school-aged children in rural areas, especially girls. In rural parts of Rajasthan, girls are out of school at twice the rate of boys and only 50% of women can read or write.
Educate Girls has history of success with education enrolment and quality improvement via community and cultural engagement. In 2015 the DIB contract launched to increase the scale of their work. Educate Girls’ strong community ties allow them to positively communicate the value of education within rural communities. Educate Girls account for cultural context and accordingly adapts its education provision approach. They create tailored teaching programmes to adapt user needs and improve the quality of their education.
A DIB-funded approach allowed the flexibility and support required to address difficult education challenges in Rajasthan. These challenges included one in ten girls aged 11-14 not being enrolled in school and less than a quarter of rural children in Grade 3 being able to read at a Grade 2 level or solve a subtraction problem.
3. Payment foundations
Approach
The Educate Girls DIB involved negotiated outcome prices based on estimates of expected project costs and project performance. Expectations were based on data from a randomised controlled trial (RCT) and additional baseline collection. RCTs involve one group of individuals receiving an intervention/service and their outcomes are compared to a control group of individuals, who share the same characteristics as the intervention group, but did not receive the additional intervention/service. This aligned with the “Efficiency” approach outlined in the “Pricing Outcomes ” guide.
Price per unit outcome did not inform the overall outcome payments – rather, outcome payment was determined by improvement across the whole cohort. Individual price per outcome can be calculated from overall outcome payments and allocations.
Impact estimation
Projected performance was based on data from a RCT undertaken by Educate Girls in the Jalore district of Rajasthan. The RCT was designed pro-bono by University of Michigan faculty. This information outlined the effects of Educate Girls’ activities on enrolment, retention, and learning outcomes (see also). Instiglio, the intermediary, combined performance data from Educate Girls and target area characteristics to estimate enrolment and learning outcomes. The project gathered baseline data from a census-like door-to-door survey.
Value estimation
The value of project payments was decided via CIFF and UBS OF negotiating based on expected service costs and UBS OF receiving an internal rate of return (IRR) of 10%. An IRR reflects the rate of return to investors that accounts for the risk which they absorb with their investment and how much they are paid for holding this risk. It is possible to calculate unit values for the outcomes, however this is via working backwards from overall outcomes payments and costs.
UBS OF provided US$270,000 as investment based on being the equivalent value of expected service provision costs (17,332,967 Indian Rupees). An IRR of 10% on an investment of US$270,000 corresponded to an expected outcome payment was US$367,000, 87% of CIFF’s total available outcome funding, if the targets were met (79% enrolment and +5,592 points on ASER scores). If performance exceeded these targets, CIFF could draw from a total outcome funding of US$422,000 available, which would have enabled UBS OF to earn an IRR of 15%.
According to Alison Bukhari of Educate Girls, the estimated service delivery cost took into account some of Educate Girls’ standard administrative costs to operate the programme, but did not include any administrative or transaction costs for designing or managing the DIB. A 2016 Devex piece references that if the DIB had been bigger, the overhead cost would have been a lower proportion of the project’s total costs. However, further information on what was incorporated in overhead costs is not available.
Strengths and limitations
The Educate Girls DIB was set up by stakeholders as a pilot development impact bond. Its payment approach has limitations - the payment mechanism does not set a clear financial value for individual education outcomes and is based on the cost of delivering the intervention. While a value can be extrapolated, it does not necessarily reflect an outcome preference or valuation.
4. Payment specification
Cohort
The project focused on children living in the Bijoliya, Mandalgarh and Jahajpur blocks in the Bhilwara district of Rajasthan. The project targeted two different, but overlapping, outcome populations. One outcome (enrolment) focused on out-of-school girls aged 7-14 and the other (learning) focused on girls and boys in grades 3-5.
The DIB funded interventions for children attending 166 government schools across 141 villages, matched to a cohort of equal number. These schools were randomly selected from a sample of 332 schools in 282 villages, from a random sample of 332 schools from an eligible population of 396 schools.
IDinsight, the independent evaluator, divided the 332 sampled schools into treatment and control groups. IDinsight used pairwise matching to balance the characteristics of treatment and control groups. Pairwise matching involves assigning villages to “pairs” based on their characteristics and randomly assigning one to the treatment group and one to the control group. Pairwise matching characteristics included:
- Block (area in region) and number of eligible schools.
- Enrolment.
- Presence of an upper primary school.
- Female-to-male student ratio.
- Student-to-teacher ratio.
Improvement
Outcome payments were allocated to “buckets” for education enrolment and quality. Pre-allocated payments only included those for minimum target outcomes, i.e. US$367,000 of the US$422,000 outcomes budget. 20% was allocated for enrolment rates and 80% for education quality. CIFF pushed for a focus on improved learning due to an identified disparity between the education outcomes of boys and girls in Rajasthan. The project measured success by improvement in enrolment and education quality based on:
- Enrolment of girls (age 7-14) in schools.
- Improved quality of education girls and boys in grades 3 to 5.
Enrolment was measured by identifying the percentage of out-of-school girls in target villages based on door-to-door surveys. This involved a pre-post evaluation of enrolment rates. IDinsight, the independent evaluator, verified enrolments by visiting schools and cross-checking school registers against interview data from principals, teachers, and parents.
Education quality was measured using standardised testing for literary and maths. The project used the Annual Status of Education Report (ASER) test, which measures proficiencies in Hindi, English and mathematics. The ASER test is a widely used and accept method to provide rigorous assessment of the education outcomes of social sector programmes.
Measurement involved annually assessing a panel of students using ASER tests over the three-year evaluation. The impact was calculated by aggregating the differences between cohorts’ baseline and final learning levels for the intervention group and comparing this to the aggregate change in test scores in the matched control cohort. Using aggregate, rather than average, scores linked the quality education payments to improved enrolment in effective schooling.
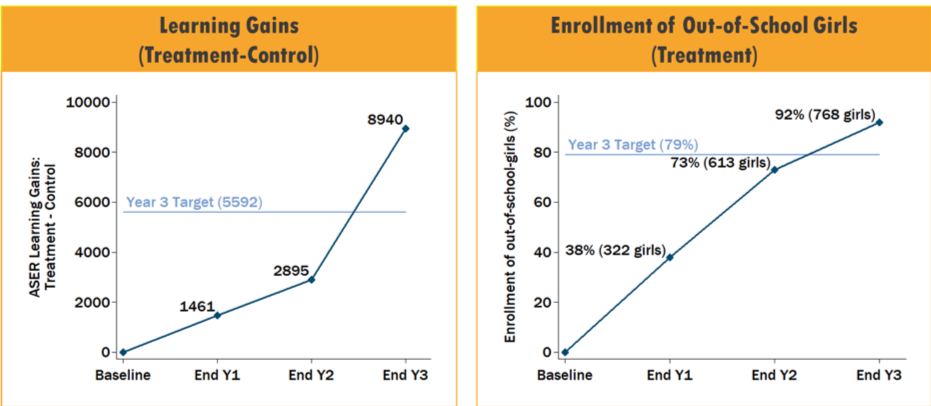
Impacts were measured over three years. Data collection began in August 2015 and ended in February 2018. Final results were announced in July 2018. Project targets and final measures achieved were:
- Re-enrolment of 79% of eligible students. By project end, 92% were enrolled.
- Improve scores by 5,592 points on ASER tests. The DIB working group revised this down from 6,664 in Year 1. By project end, an improvement of 8,940 points was achieved, surpassing original and revised targets.
The figure below displays outcome progress over the course of the project (2015-2018).
Timing and structure of payment
The payment was made in one lump sum in July 2018, following the verification of successful project results.
Outcome funding was divided between lump sum payment for investors and an additional payment to Educate Girls to incentivise reaching programme milestones. UBS OF negotiated with Educate Girls to pay the incentive payment at a rate 32% of interest payments which the Foundation received if outcomes were met, up to an IRR of 15%.
The payment structure rationale was to pass 'upside' financial benefit risk to providers and incentivise performance without passing on downside risk (financial loss). This upside benefit was in addition to non-financial risks, such as reputational risks, that Educate Girls was exposed to in the DIB. Payments were set up as as a single pay out to the investor at the end of the project.
Additionality
The Educate Girls DIB used matched controls and a historical baselines to evaluate the effect of the service provision on education outcomes.
Assessments for learning outcomes compared the intervention and matched control groups of schools. Evaluations were made at baseline in September 2015 and in February of each subsequent year (2016, 2017, 2018). In total, IDinsight conducted over 25,000 assessments across more than 11,000 students. For the intervention group, which was compared to a historical baseline, IDinsight enumerators followed up with students who were absent from school, such that the attrition rate over the three-year evaluation was below 4%. Each August, IDinsight validated additions to the out-of-school census.
Due to census costs, IDinsight did not estimate enrolment in control villages. The Instiglio DIB design memo notes several potential factors influencing the enrolment of out of school girls. A causal effect cannot be measured for the effect of Educate Girls’ program on enrolments, due to the a lack of comparator group.
IDinsight incorporated several measures to mitigate bias and ensure results were robust. To mitigate bias IDinsight operated independently from the Educate Girls program and its field staff. IDinsight project enumerators were sent to a variety of schools and were not informed of the village’s assignment to treatment or control. Their data were also collected digitally and reviewed daily to evaluate if there were any missteps in collection. The risk of skew, due to gaming or cheating, in the ASER tests was assumed to be low. This is due to the difficulty in “faking” ability in the language and mathematical reasoning tests. The size of the study (roughly 12,000 participants) also supported the statistical robustness of estimates.
5. Payment certainty
Likelihood of success
It is not clear how likelihood of success was incorporated into planning of the DIB payment mechanism.
Outcome calculations focused on the aggregate difference between treatment and control groups. IDinsight calculated the minimum detectable effect size base on a sample of 332 schools in 282 villages. This showed that if true treatment effect on ASER scores was 0.47 points, then the evaluation would have a 20% chance of failing to distinguish the treatment effect this – giving a false negative. The observed difference in learning gains was 1.08 ASER learning levels, a difference that statistically significant at the 1% level. This implies that the probability of observing this difference, if there is actually no treatment effect, is less than 1%.
Accounting for different scenarios
Statistical uncertainty was not incorporated into outcome payment calculations. Example potential payment scenarios are outlined in Instiglio’s design memo, but these were updated following implementation of the EG DIB.
Financial boundaries
The maximum total outcome payment was US$422,000. The minimum outcome payment of US$0 was tied to the project having no impact at all.
6. Further information
Limitations and lessons learned
Final evaluation reports from Educate Girls, IDinsight, and the UBS OF highlight limitations and lessons learned from stakeholder perspectives. External case studies offer further analysis, conclusions, and recommendations about the Educate Girls DIB.
The use of an outcomes-based payment mechanism created several positive spillovers. The mechanism created incentives for Educate Girls to more rigorously evaluate the data collected and analysed by IDinsight. Subgroup analyses, available due to the breadth of information collected about study participants, allowed Educate Girls to understand how their services were impacting individuals differently within the intervention group. This supported Educate Girls’ substantial adaptation and expansion of activities in project year 3.
Learnings from the Educate Girls DIB are directly feeding directly into the Quality Education India DIB, an ambitious US$11 million project coordinating service provision across three NGOs.
Primary Sources
- Kate Sturla - ID insight
- Jeffrey McManus – IDinsight.
- Alison Bukhari - UK Director, Educate Girls
Secondary Sources
- Government Outcomes Lab. Case studies: Educate Girls [Internet]. 2018. Available from: https://golab.bsg.ox.ac.uk/knowledge/case-studies/educate-girls/
- Instiglio. Design Memo: Educate Girls Development Impact Bond [Internet]. 2015. Available from: http://instiglio.org/educategirlsdib/wp-content/uploads/2016/03/EG-DIB-Design-1.pdf
Appendix: assessing VfM
8 minute read
In this appendix, we discuss a new approach to assessing value for money, for those with analytical capacity and a strong need to provide clear VfM justification of the price set. We would like to invite discussion on this approach and its practical utility, and how it might be further developed.
After deriving the value and estimating the costs, you will have a better understanding of a range of possible prices (the range between P3 and P1 in the figure below). Depending on how you set the price, there might be per outcome net financial benefits (P2 less P1), non-financial benefits (P3 less P2), or the combination of both.
Another case scenario that could happen is where financial benefits are not greater than costs, but non-financial benefits are (P2 < P1 < P3). This is where decision making could become harder, depending on how much the society values the non-financial benefits at the time. See more on this in our blog.
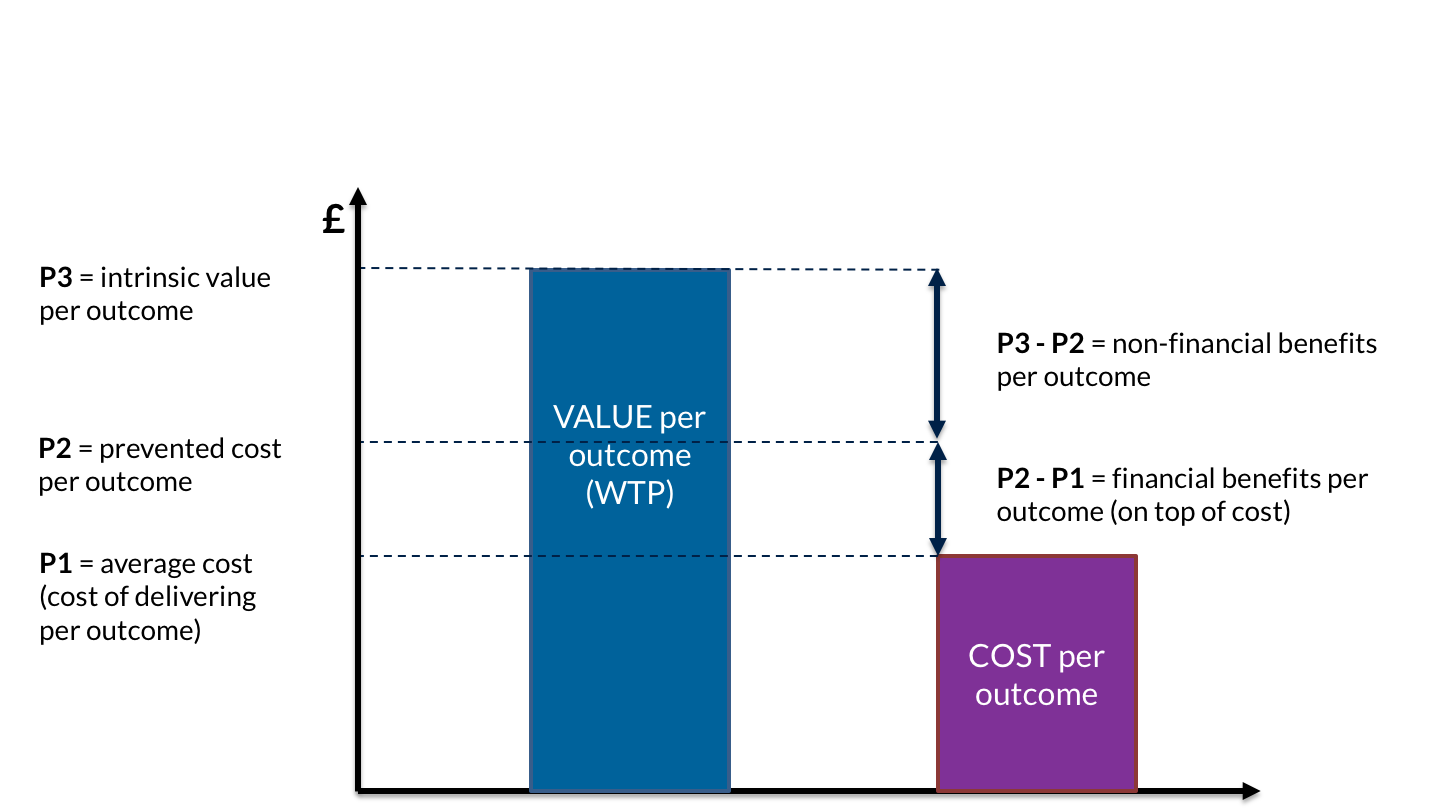
Considering that resources are constrained, the goal should be to use resources optimally so to achieve the intended outcomes. In the UK, for example, the HM Treasury Green Book defines “potential Value for Money” as: “optimising social value (social, economic and environmental), in terms of the potential costs, benefits and risks”.
Value for money has become a much-buzzed about concept in international development in recent years. Primarily used in developed or middle-income countries—where there is more money and more options—a central question is this: should we also use this tool for projects in low-income countries?
The simplicity of the term ‘value for money’ belies the diversity of practical interpretations of the concept. At its best, it is a fully integrated, value creating, impact enhancing practice that is informed by various sources and stakeholders, which supports ongoing organisational and programmatic improvements. It is integral to organisational performance. However, there are also fears that it can be interpreted narrowly to focus on cost-minimisation, or on short-term rather than long-term value, or to justify doing what matters to those providing aid rather than those receiving it.
Based on guidelines published by the government of the UK, there are three criteria to assess the VfM, namely:
- Economy: minimising the cost of resources used or required (inputs) – spending less
- Efficiency: the relationship between the output from goods or services and the resources to produce them – spending well
- Effectiveness: the relationship between the intended and actual results of public spending (outcomes) – spending wisely
The three ‘E’s framework shows that the Value for Money agenda is not just about cutting costs. Maximising actual outcomes and impacts that are bought with (taxpayer) money is the key part of the VfM agenda.
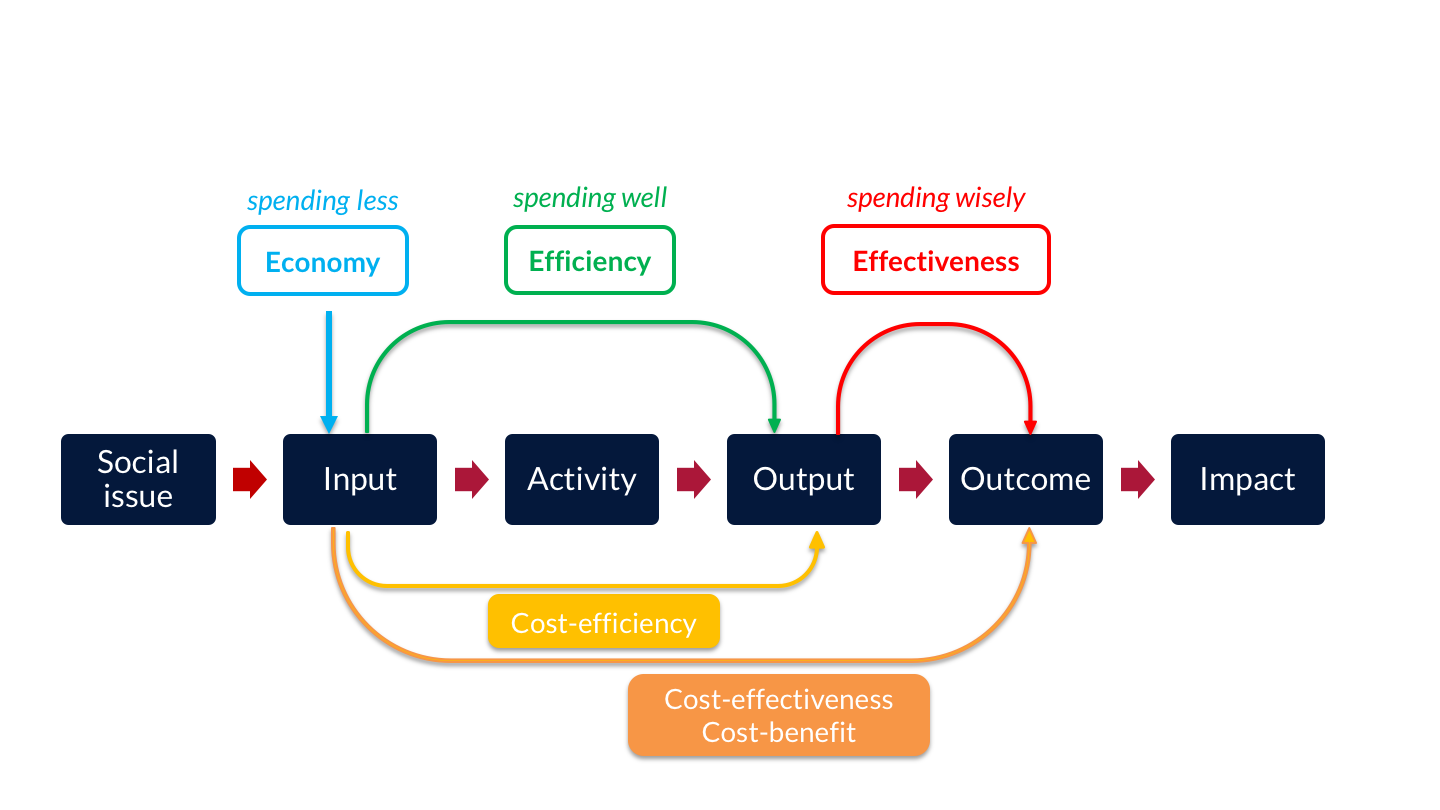
There is a fourth criteria as well that is recommended to have taken into consideration when applicable: equity. This is relevant in all stages of impact bond models, and represents ‘Spending Fairly’, i.e. the extent to which services are available to and reach all people that they are intended to.
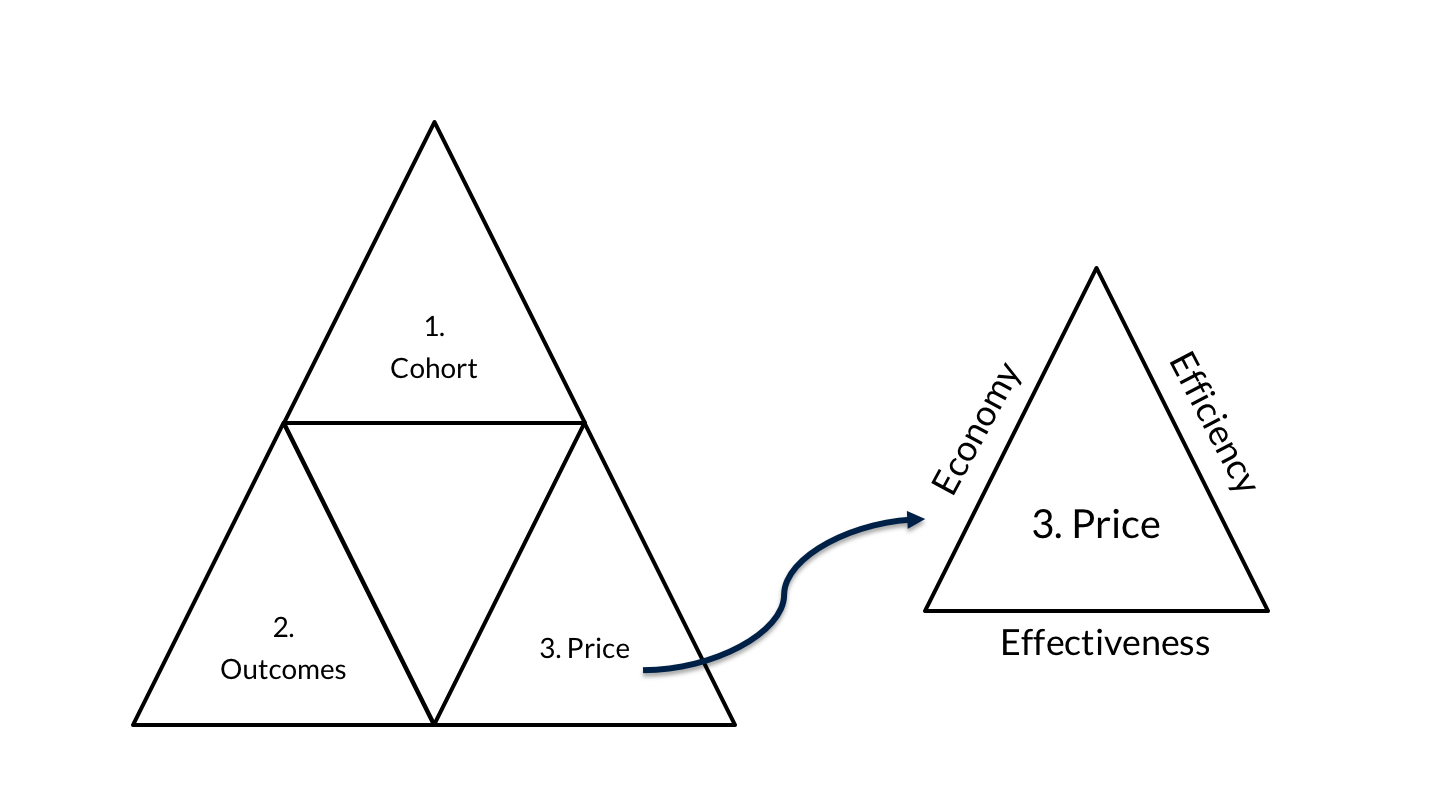
A.1 Economy
Are inputs of appropriate quality bought at a minimised price?
This criterion is about the costs borne throughout the programme. Inputs (e.g. time, staff, consultants, raw materials capital, and etc.) should have been procured at the least cost for the relevant level of quality.
In order to satisfy this condition, the price paid for outcomes should be the least possible and there should be no other way to achieve them cheaper. This requires some level of market study and then further negotiations with different providers (and/or investors). A comparison of costs is essential for price setting regardless of the intervention being original or based on a legacy programme. We have already discussed how to estimate costs earlier in this guide.
Keep in mind that the outcome price paid to the provider (and/or investor) is not the outcome payer’s only cost, as additional resource may be needed, such as for monitoring and evaluations, which count as inputs. The overall price which needs to be minimised is the sum of all the costs borne by the outcome payer. This price should be comparable to compatible services to satisfy the economy criterion of VfM.
Some of the costs of the outcome payer (i.e. demand side) in impact bond models are described in the table below. This should not be confused with the costs of the ‘supplier’ side discussed earlier in the guide.
The outcome payer should have (or develop) a good understanding of how much will end up being paid for the outcome using template such as the above or based on comparable contracts already running. If you are considering an OBC model, you might feel that while the service is being delivered is in line with the service specification (or equivalent), it is not producing as many good outcomes for individuals as you think it could.
Current costs may be difficult to assess in full as they include costs that may be difficult to apportion (e.g. managerial and other staff cost, including ‘overheads’). In an outcomes contract or SIB, there will be costs built in for investor returns if the service achieves its aims, and sometimes for increased performance management and data collection. But these costs might worth paying if performance is improved enough compared to the full cost of existing service provision, especially when considering managerial / overhead costs which are often left out. This is where the other criteria of VfM come into place.A.2 Efficiency
How well are inputs converted into outputs?
Efficiency is generally defined as the value of ‘outputs’ in relation to the total cost of ‘inputs’ (at the relevant level of quality). This criterion also assesses anything affecting the conversion of inputs into outputs, including setting and measuring outcomes, monitoring, evaluation, project management, and so on. The foremost role of price in satisfying this condition is undeniable, as cost per output needs to be compared to benefit per output as part of the assessment.
Normally it should be possible to distinguish between output and outcome, e.g. in most of the preventative and early intervention programmes the target is of an ‘output’ nature which is positively associated with some ‘outcome’ in the future. Occasionally however, there might be cases where you cannot distinguish between output and outcome in an OBC due to the type of indicators you use for outcome payment. This is where the difference between ‘efficiency’ and ‘effectiveness’ becomes less apparent. So, you may be constrained by a lack of reliable information to indicate both full costs and output achievement for existing services.
Another issue affecting efficiency of IBs compared to either OBCs or conventional fee-for service might be lack of competition in the supply market due to the limited number of investors and/or providers. It is highly recommended however to encourage competition between potential providers as this will tend to promote efficiency. This will be important in an era of ‘more for less’ across the public sector.
A comparison of expected costs and outputs could provide some understanding of how well the services are priced and being delivered, both in their own right and in comparison to the conventional methods. The ratio of output to costs could be a measure for comparison.A.3. Effectiveness
How well do those outputs achieve outcomes?
Unlike fee-for services, OBCs use outcomes as the basis for payments, and therefore the total cost of inputs should ensure that the outputs deliver the desired outcome. Price per outcome is probably the most influential factor in your total costs, along with the size of the cohort, so careful consideration is once again advised when setting the price to satisfy this criterion.
General opinion is that outcomes are more expensive than outputs. To illustrate, imagine you are an outcome payer and in a ‘block contract’ or in a ‘fee-for-service’ arrangement, you may be paying £10,000 to engage 100 participants in the training. This is £100 per participant (£10,000 divided by 100 participants). You pay this regardless of the success of the programme in achieving the set outcome. However, if only 20 of them achieve the desired outcome, the price per outcomeis in fact £500 – that’s £10,000 divided by 20 participants. So in reality, you paid £500 per outcome. In an OBC version of the similar programme, you might agree to pay £500 for each outcome to start with. Or, if the programme seeks to improve the “effectiveness” of the spend, you might seek to pay, say, £400 per outcome, such that you can get more outcomes for the same total payment, or the same outcomes for less total payment.
A potential complication with assessing effectiveness in OBCs is that sometimes outcomes are realised only in the long-run and are therefore hard to monitor. For instance, preventative and early intervention programmes are aimed to improve future chances. In such circumstances, the best way is using data analysis is to find (i) the rate of output to outcome conversion, and then (ii) use the information to predict future benefits and costs. Pay attention, discounting and measuring present values are essential when dealing with calculations happening at different times in the future (find more about these concepts in A6 of the Green Book).
The table below gives a simple comparison of the three criteria of Value for Money. You could learn more about VfM analysis in the Economic Evaluation chapter of our Evaluation Guide. For an overview of VfM analysis across the globe see this World Bank document.
| DESCRIPTION | EXAMPLES OF INDICATORS | |
|---|---|---|
| ECONOMY | Evaluating whether the inputs of the appropriate quality are bought at the right price |
Cost drivers; e.g. outcome payment, staff costs, capital, cashflow, & etc.; Payment mechanism. |
| EFFICIENCY | Evaluating how well inputs are converted into specific outputs with expected quantity and quality |
% of targeted outputs achieved; % of eligible persons achieving target; Per person cost and benefit comparison Cost-efficiency (output input ratio). |
| EFFECTIVENESS | Evaluating how well outputs from an intervention are converted into sustained actual outcomes. OBCs offer more control over outcomes than conventional methods. |
% of outputs translated into actual outcomes. % of ‘expected outcomes’ translated into actual outcomes; |
Acknowledgements
In the GO Lab team, Nigel Ball, Executive Director and Mehdi Shiva, Economist coordinated the development of this guide. This would not have been possible without the contributions made by our associates. These are: former GO Lab research interns Vaby Endrojono-Ellis and Lorcan Clarke; Fellows of Practice - Tim Gray, Neil Stanworth, Tara Case and Alison Bukhari; Former Fellows of Practice - Mila Lukic, Tanya Gillett; our partners at Social Finance - Jane Newman, and Marie-Alphie Dallest, Cat Remfry from the Centre for Social Impact Bonds at DCMS as well as Louisa Mitchell, CEO of West London Zone.
We warmly welcome any comments or suggestions. We will regularly review and update our material in response. Please email your feedback to golab@bsg.ox.ac.uk.